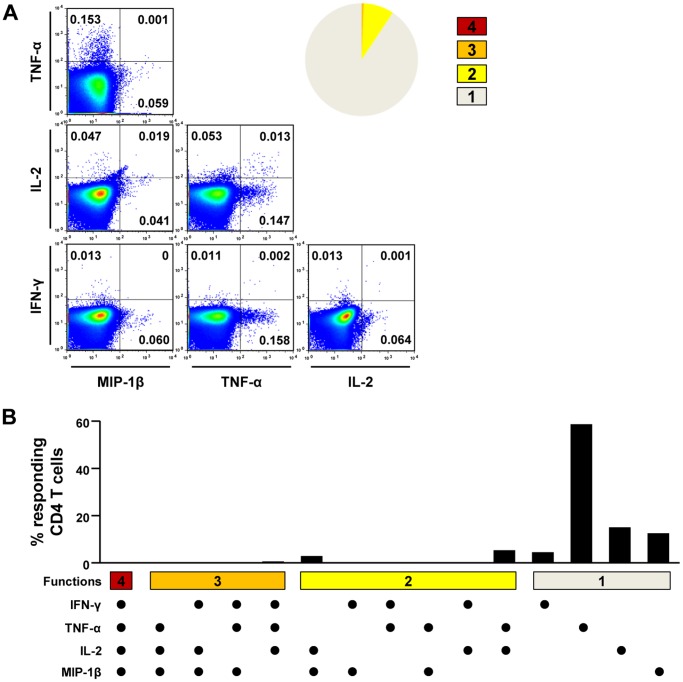
Figure 5. Polyfunctionality assay of HCV-specific T cells in the patients of group II.
Representative example of polyfunctionality assays of CD4+ T cells in CMI-8 is presented. PBMCs were stimulated with NS3 peptide mix, and IFN-γ, TNF-α, IL-2, and MIP-1β production were assessed. The data are presented by FACS dot plots and the pie graph shows the fraction of T cells positive for a given number of functions (A). Detailed analysis of polyfunctionality is presented with every possible combination of functions (B).

