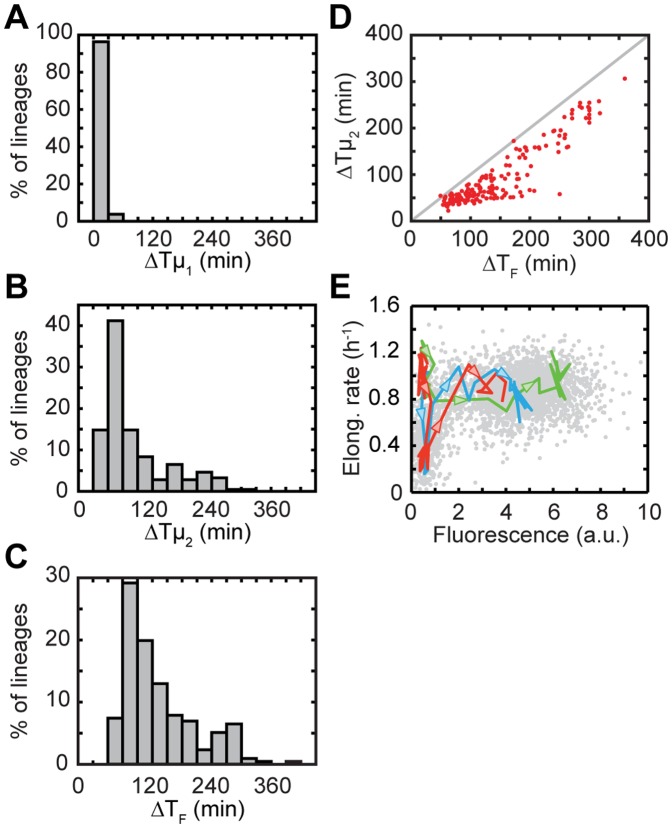
Figure 3. Statistical analysis and correlation between expression and growth.
(A) Distribution of growth decrease times ΔTµ1. (B) Distribution of growth recovery times ΔTµ2. (C) Distribution of fluorescence recovery times ΔTF. N = 216 for all histograms. (D) Scatter plot of the delays in growth recovery versus delays in fluorescence increase for 185 cell lineages. r2 = 0.85, p-value <0.001. The line drawn is ΔTµ2 = ΔTF. (E) Elongation rate versus internal lac levels for all lineages (scatter plot, in grey) and the three lineages in Figure 2C. Arrows are directed towards increasing time.

