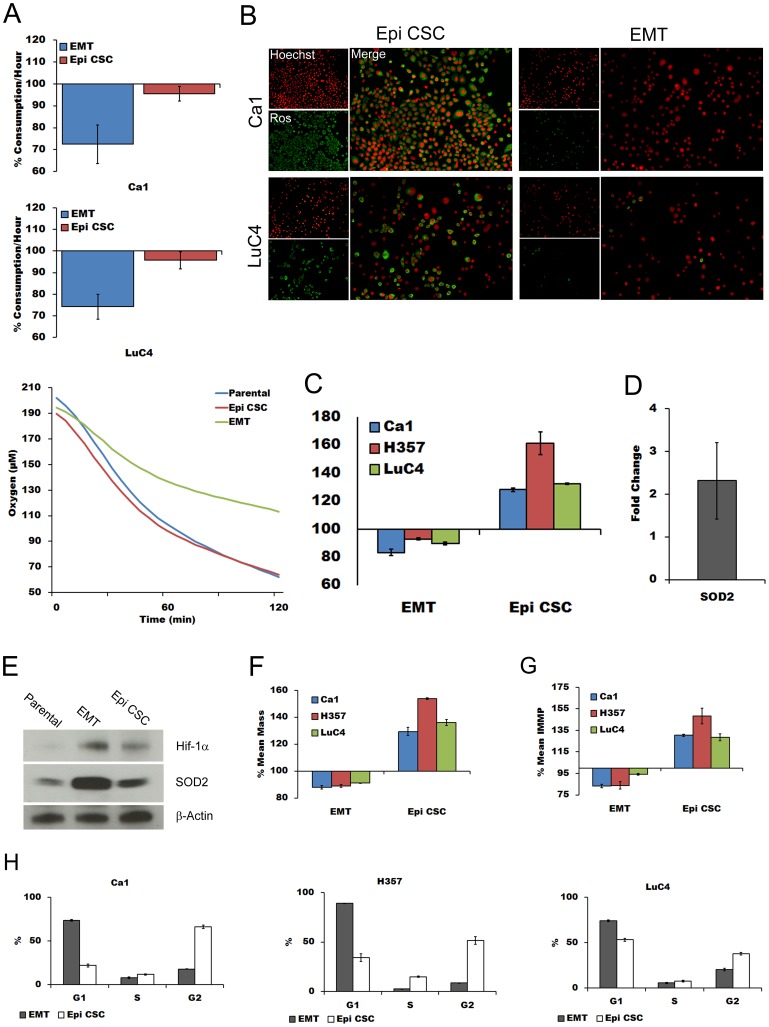
Figure 5. EMT CSCs have reduced oxygen consumption, less ROS, reduced mitochondrial mass and inner membrane potential, increased SOD2 and an altered cell cycle.
A; relative oxygen consumption of EMT and Epi CSC fractions compared to that of parental line for the first hour (top panels) and for Ca1 over 2 hours (below). B; immunofluorescent images comparing ROS levels in EMT and Epi CSCs counterstained with Hoechst. C; flow cytometric analyses of mean ROS levels of EMT and Epi CSCs relative to parental cells. D; PCR fold differences for SOD2 between EMT and Epi CSCs. E; western blots for HIF-1α and SOD2 for the 3 sub-fractions of Ca1 cell line. F; mean mitochondrial mass of EMT and Epi CSCs relative to parental cells. G; comparison of IMMP of EMT and Epi CSCs relative to parental cells. H; cell cycle profiles for EMT and Epi CSC fractions of the 3 cell lines.

