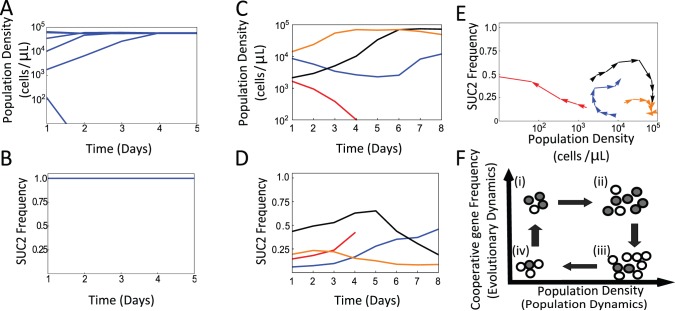
Figure 1. Population dynamics in the presence and the absence of evolutionary dynamics.
Multi-day growth-dilution cycles demonstrate that evolutionary dynamics of a cooperative gene may dramatically affect population dynamics. (A–B) Yeast populations consisting exclusively of cooperator cells rapidly converge to an equilibrium population size in the absence of evolutionary dynamics (daily dilution by 667×). (C) Four different populations consisting of a mixture of SUC2 carriers and deletion mutants were subject to 8 days of growth dilution cycles. Populations started at different population densities and SUC2 frequencies in the population. (D) Evolutionary dynamics for the same four populations as in (C) are represented by the same colors. Plots of the population and evolutionary dynamics show seemingly erratic, non-monotonic behavior. (E) By constructing an eco-evolutionary phase-space formed by the population size and the frequency of the SUC2 gene in the population, we find that the four populations in (C–D) follow well defined trajectories. Each trajectory corresponds to the evolutionary and population dynamics of the same color. (F) A simple conceptual model rationalizes the eco-evolutionary trajectories; gray circles represent cooperators, white circles represent cheaters.

