
Figure 3. The presence of cheater cells decreases the resilience of a population.
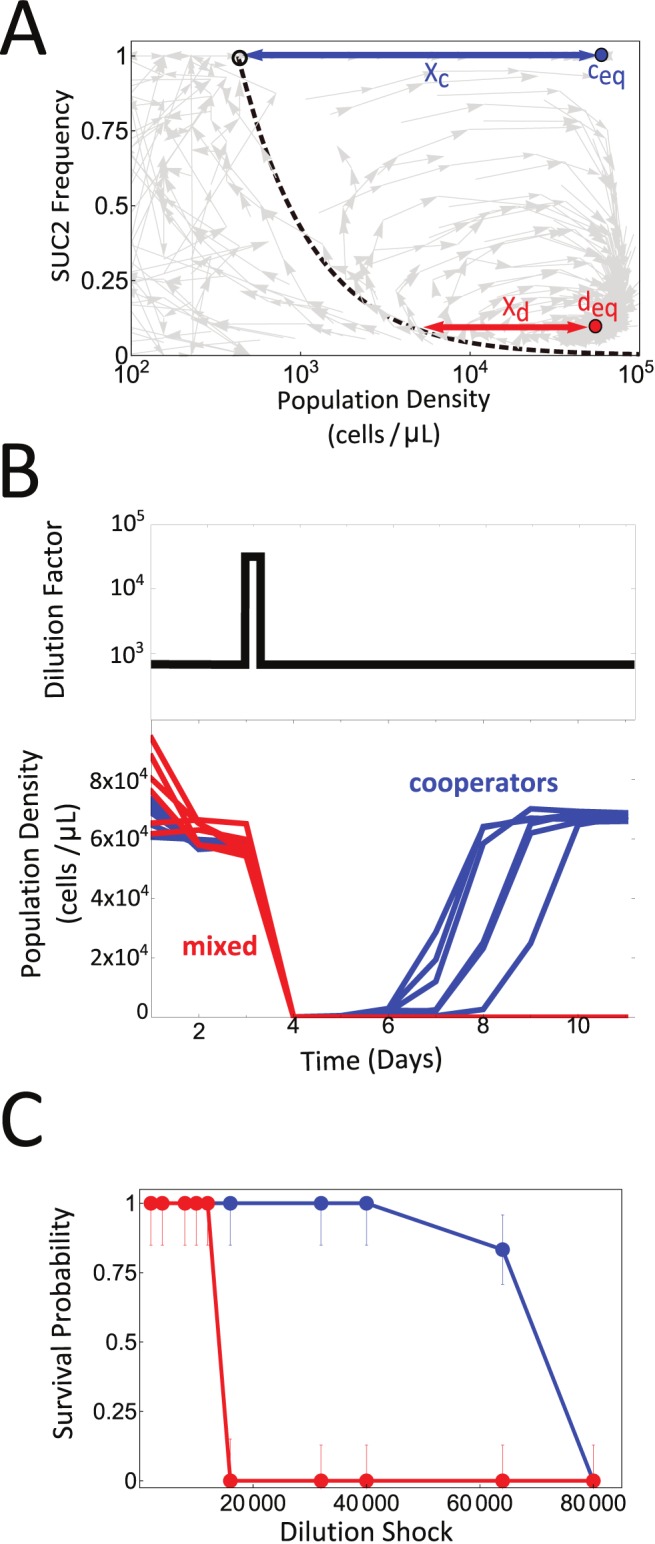
(A) 180 eco-evolutionary trajectories corresponding to three different experiments are plotted in light gray. On top, we represent the population dynamics equilibrium point for pure cooperator cultures ceq (blue dot) and the eco-evolutionary equilibrium point deq (red dot). The blue arrow marks the distance between ceq and the separatrix (Xc), and the red arrow marks the horizontal distance between deq and the separatrix (Xd). (B) Populations were started near ceq (blue) or deq (red) at a dilution factor of 667×. A large disturbance was applied on the third day of culture, by increasing the dilution factor to 32,000× for one day (top panel). Pure cooperator populations were able to recover, but the mixed cooperator/cheater populations in eco-evolutionary equilibrium went extinct. (C) Survival probability as a function of the strength of the perturbation (i.e., dilution shock). The presence of cheaters (red circles) decreases the population resilience, i.e., the maximum dilution shock that the population can withstand, relative to pure cooperator populations (blue circles). Error bars were estimated assuming binomial sampling (n = 6), and represent a 68.27% confidence interval.