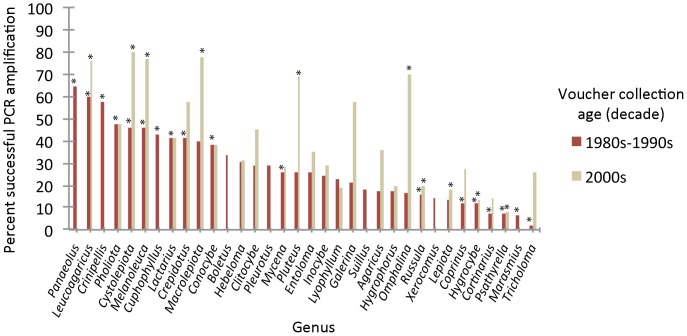
Figure 2. Association between taxon (controlled for specimen age) and PCR amplification success using primers ITS1F and ITS4.
Pearson Chi-square test of independence: p<0.0001. Asterisks denote categories with standardized adjusted residuals significant α = 0.05. See Table S3 for data and post hoc test results.

