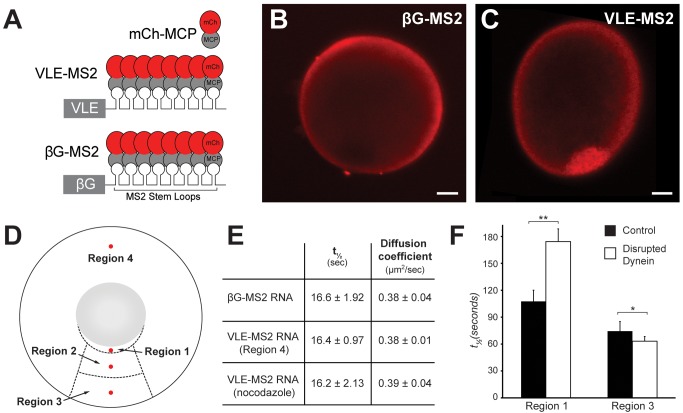
Figure 4. Live imaging of RNA localization reveals RNA transport dynamics.
(A) Diagram of VLE RNA (VLE-MS2) and nonlocalizing β-globin RNA (βG-MS2) tagged with multimerized MS2 binding sites, which recruit MS2 coat protein fused to mCherry (mCh-MCP). (B) Oocytes expressing mCh-MCP and injected with βG-MS2 RNA exhibit uniform cytoplasmic fluorescence. (C) Oocytes expressing mCh-MCP and injected with VLE-MS2 RNA exhibit strong vegetal fluorescence (red). (B–C) Images of live oocytes are shown, with vegetal poles towards the bottom; scale bars, 20 µm. (D) Diagram of oocyte showing regions used for analysis: cup region immediately adjacent to the nucleus on the vegetal side (Region 1), the upper vegetal cytoplasm (Region 2), the lower vegetal cytoplasm (Region 3), and the animal hemisphere (Region 4). The 5 µm circular regions for FRAP are indicated in red and are spatially defined in Materials and Methods. (E) Calculated half times of recovery and diffusion coefficients from FRAP analysis. βG-MS2 RNA mobility was measured in Regions 2–4 and VLE-MS2 RNA mobility was measured in Region 4. After nocodazole treatment, VLE-MS2 RNA mobility was measured in Regions 2 and 3. ± indicates standard error of the mean. (F) Averaged halftimes (t½) of recovery for indicated regions in control oocytes (black bars) or oocytes with dynein function disrupted by expression of CC1 (white bars). Control (Region 1, n = 10; Region 3, n = 10), Disrupted dynein (Region 1, n = 21; Region 3, n = 22). Error bars show standard error of the mean. Half times of recovery (t1/2) and diffusion coefficients were calculated as described in Materials and Methods. The p values were generated using a two-tailed unpaired Student's t test; ** p = 0.0054, * p = 0.299.

