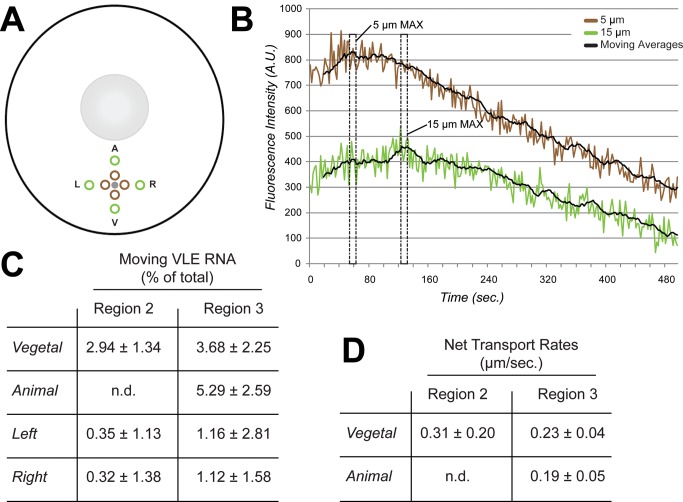
Figure 6. Analysis of net transport after photoactivation.
Oocytes expressing PA-mCh-MCP were injected with VLE-MS2 RNA and photoactivated as in Figure 5. (A) Collection windows were defined at 5 µm (brown) and 15 µm (green) from the site of photoactivation (gray) in all four directions: Animal (A), Vegetal (V), Left (L), and Right (R). (B) Data from an oocyte activated in the lower vegetal cytoplasm and collected on the vegetal side of the activation point are shown. Fluorescence intensity collected in the defined windows is plotted over time, along with a moving average trendline (period = 10). The timepoints of intensity maxima (MAX) for the 5 µm (t1) and 15 µm (t2) collection windows are indicated by dashed boxes. (C) The percentages of VLE-MS2 RNA moving in the Vegetal, Animal, Left, and Right directions were calculated by measuring change in fluorescence intensity in collection windows 5 µm and 15 µm away from the activation point (see Materials and Methods for details). Standard deviation is indicated by ±, n = 5. RNA movement in the animal direction could not be detected (not detected, n.d.) in Region 2 because intensity maxima in the collection windows were simultaneous, suggesting no transport in this direction within Region 2. (D) Transport rates were calculated for the motile fraction of VLE-MS2 RNA in Regions 2 and 3 by identifying time points (t1, t2) of peak fluorescence intensity in collection windows 5 µm and 15 µm away from the activation point (see Materials and Methods for details). The calculated rates of net RNA transport are shown, with error (±) given as standard deviation, n = 5.

