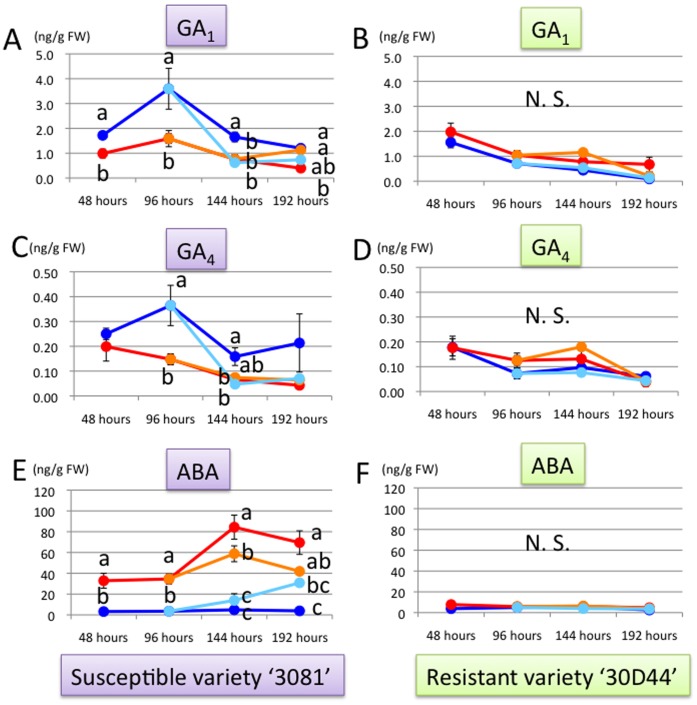
Figure 2. Changes in GA1, GA4 and ABA concentrations in the third leaf of maize.
(A) GA1 concentration (ng/FW) in the variety ‘3081’. (B) GA1 concentration (ng/FW) in the variety ‘30D44’. (C) GA4 concentration (ng/FW) in the variety ‘3081’. (D) GA4 concentration (ng/FW) in the variety ‘30D44’. (E) ABA concentration (ng/FW) in the variety ‘3081’. (F) ABA concentration (ng/FW) in the variety ‘30D44’. Line colors indicate leafhopper treatment for eight days (red lines), control (blue lines), early leafhopper treatment for four days (orange lines), and late leafhopper treatment for four days (light blue lines). Different letters indicate significant differences between control and treatments at each time point (ANOVA; followed by Tukey’s HSD test at 144 and 192 hours).

