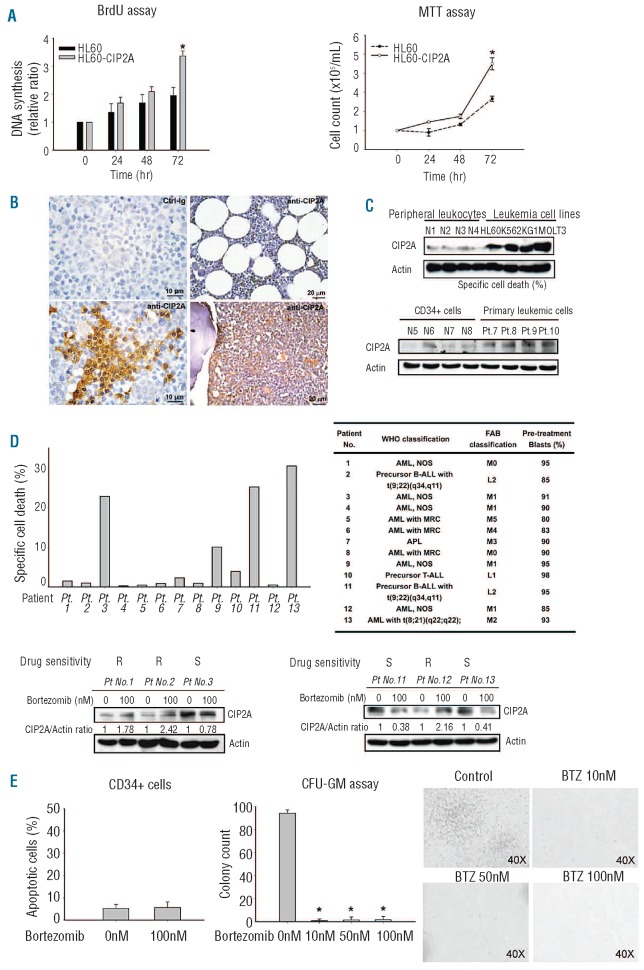
Figure 4.
Effects of bortezomib in primary leukemia specimens. (A) (Left) DNA synthesis of HL-60 and HL-60-CIP2A cells as measured by BrdU incorporation assay. Columns, mean (n=3); bars, SD; *P<0.05. (Right) cell proliferation curve of HL-60 and HL-60-CIP2A cells as measured by MTT assay. Points, mean (n=3); bars, SE; *P<0.05. (B) CIP2A immunohistochemical staining in paraffin-embedded bone marrows from patients with acute myeloid leukemia (AML) and from controls. (Upper left) No signal was detected in an AML bone marrow stained with control rabbit IgG as a control. (Upper right) Weak and focal stainings for CIP2A in the bone marrow tissue of a patient with idiopathic thrombocytopenic purpura (ITP). A similar result was seen in another patient with ITP (not shown). (Lower left) The same AML bone marrow in upper left panel showed positive signals for CIP2A in tumor cells. (Lower right) Diffuse and intense CIP2A expression was detected in the bone marrow of another patient with AML. Scale bars are shown. (C) Comparison of CIP2A expression by Western blot analysis in peripheral leukocytes from normal healthy volunteers (N1-N4) and in the four leukemia cells (upper) and comparison of CIP2A expression in CD34+ normal hematopoietic cells (N5-N6) and in primary leukemic cells (Patient ns.7–10) (lower). The CIP2A expression is significantly higher in the human leukemic cell lines than in the normal peripheral leukocytes. Similarly, CIP2A expression is higher in primary leukemic cells than in CD34+ normal hematopoietic cells. Representative of 3 independent experiments. (D) Effects of bortezomib in primary leukemic cells. Primary leukemic cells from 13 patients were collected and treated with bortezomib 100 nM for 12 h. Specific cell death by bortezomib was defined in Design and Methods. (Upper left) Bortezomib induced significant apoptosis in some primary leukemic cells. (Upper right) The WHO and FAB classifications of 13 patients (ns. 1–13) with leukemia and percentage of leukemic blasts in marrow. (Lower panel) Selective Western blot analysis of primary leukemic cells treated with bortezomib. In bortezomib-sensitive samples (patient ns. 3, 11 and 13), bortezomib-induced cell death correlates with downregulation of CIP2A. In bortezomib-resistant samples (patient ns. 1, 2 and 12), bortezomib fails to down-regulate CIP2A expression. Representative of 3 independent experiments. Pt.: patient; AML NOS: acute myeloid leukemia not otherwise specified; ALL: acute lymphocytic leukemia; AML with MRC: acute myeloid leukemia with myelodysplasia-related changes; S: sensitive; R: resistant. (E) Effect of bortezomib on normal hematopoietic stem cells. Short-term treatment (6 h) with bortezomib did not significantly induce apoptosis in CD34+ normal hematopoietic cells (left). Bortezomib suppressed colony-forming ability of CD34+ normal hematopoietic cells (middle). Columns, mean (n=3); bars, SD; *P<0.05. Representative photocopies of clonogenic (CFU-GM) assay were shown (right). For CFU-GM assay, collected CD34+ normal hematopoietic cells were treated with bortezomib 0, 10, 50 and 100 nM for 6 h and cultured in MethoCult® methylcellulose-based medium as described in Online Supplementary Design and Methods. Colonies were scored after 14 days of culture.

