
Figure 1.
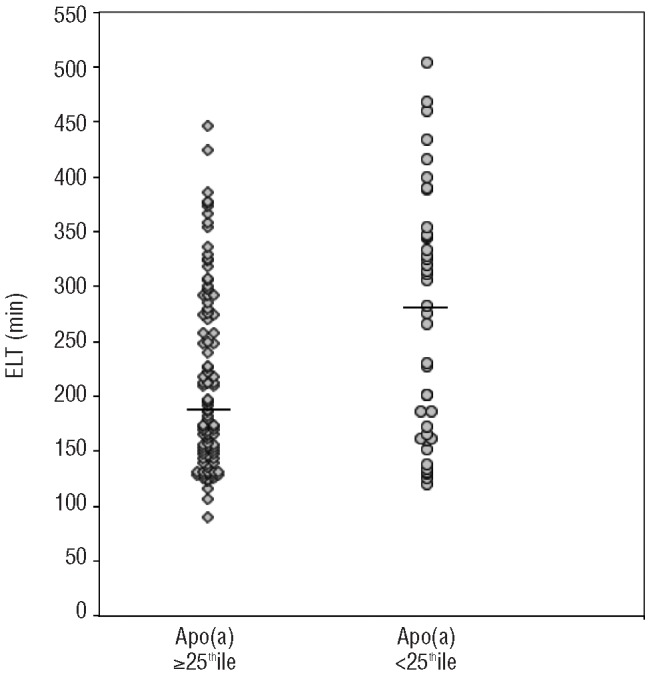
Scatterplot of plasma fibrinolytic function, as measured by euglobulin lysis time (ELT) in the automated euglobulin clot lysis assay, for children with predominant apo(a) isoform size less than versus greater than or equal to, the 25th percentile of normal values i.e., small vs. normal apo(a). ELT was significantly longer (suggesting relative hypofibrinolysis) among children with small apo(a).