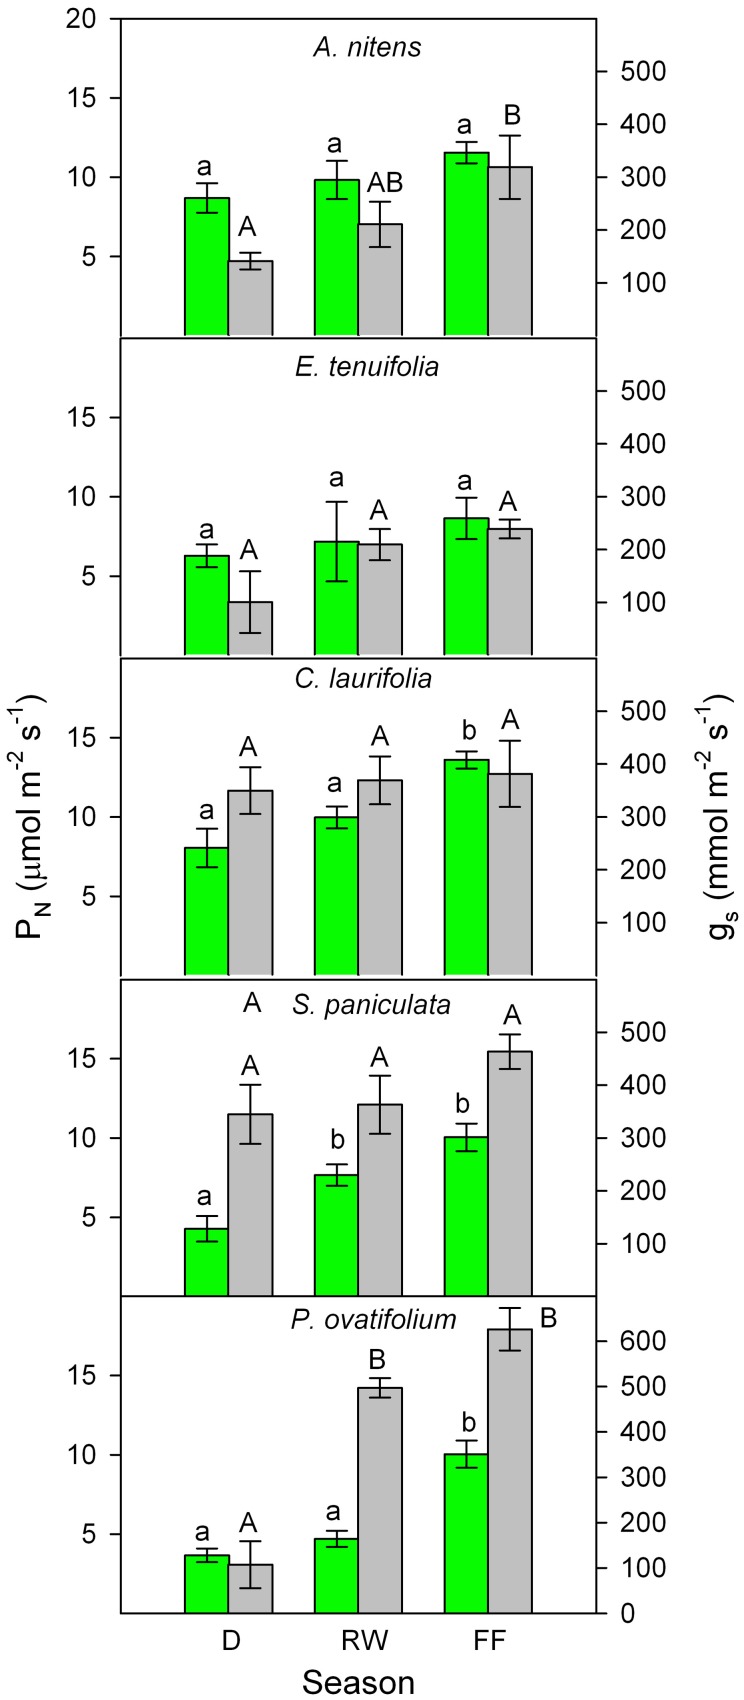
Figure 3.
Seasonal changes in photosynthetic rate (green) and stomatal conductance (gray) of the species indicated. Values are mean ± SE of measurements were made during 1995, 1996, 1998, 1999, 2000, 2003, 2004, and 2005. Different letters indicate significant differences at p < 0.05. Modified from Fernández et al. (1999), Rengifo et al. (2005), and Herrera et al. (2008a).

