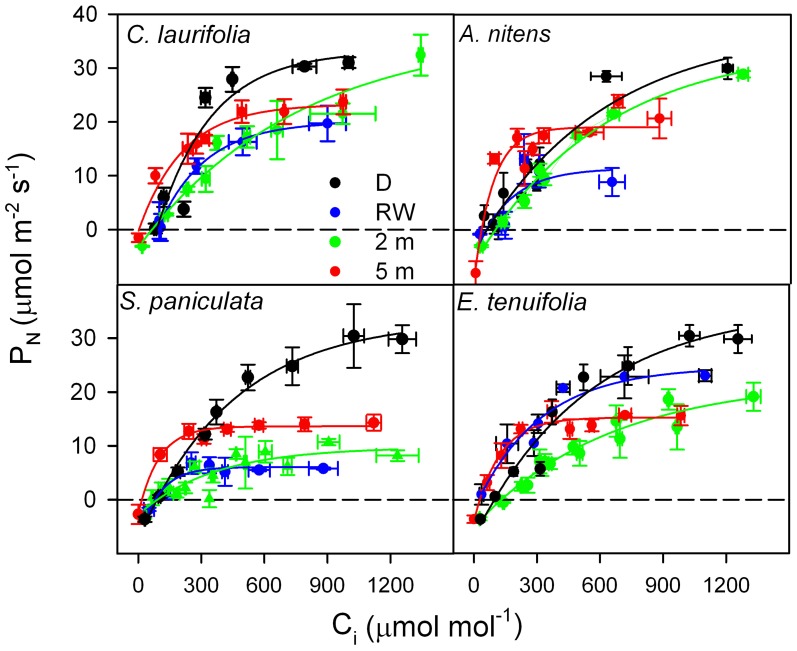
Figure 6.
Response curves of photosynthetic rate to intercellular [CO2] in the species indicated during drainage (black), rising-waters (blue), flooding by 2-m water column (green), and full flood by 5-m water-column (red). Modified from Herrera et al. (2008a).

