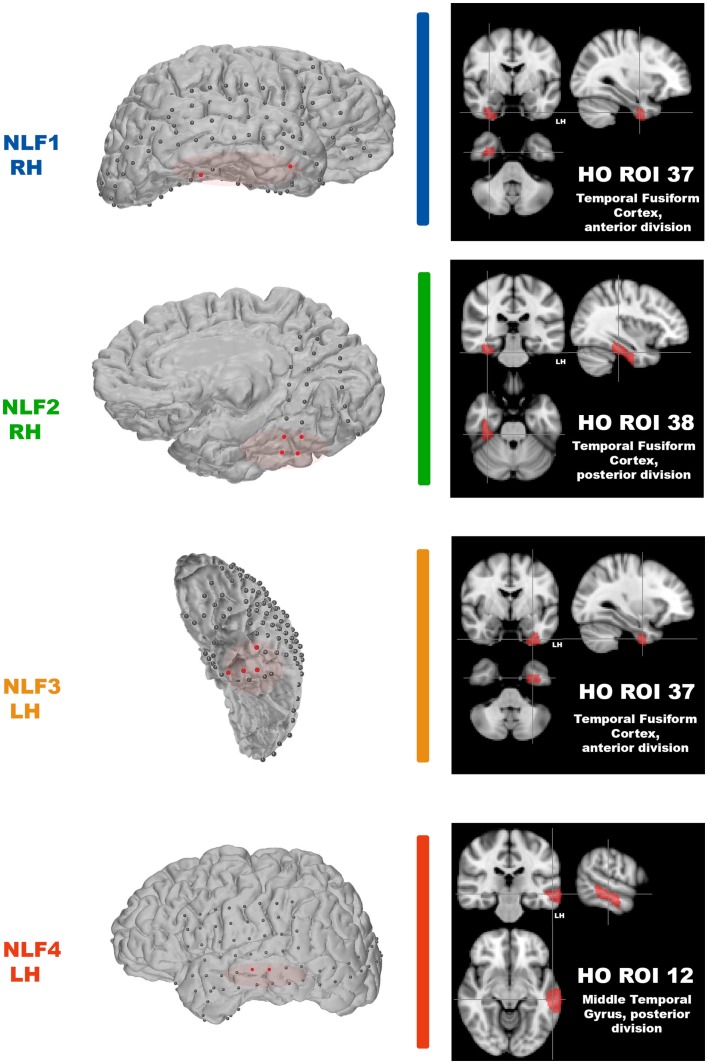
Figure 1.
Identification of the seizure focus and ROI. For each NLF subject, the seizure focus was retrospectively defined and identified as tissue showing onset of ictal discharges based on electrocorticographic findings as well as contained with the resection zone (epileptogenic zone). For consistency throughout, each NLF subject is color-coded as seen in Table 1. First column shows a 3D surface rendering of the subjects high-res T1 MPRAGE scan (generated with FREESURFER automated tools for surface reconstruction) with the overlaid ECoG grid and strip electrodes. Electrodes colored in red reveal the locales of the ECoG recorded ictal onset activity. The overlaid red transparencies show the approximate resected, epileptogenic zone. The second column (black boxes) plots the HO ROI (on the MNI 152 brain) that overlaps with the electrode falling within the seizure focus for each NLF subject.

