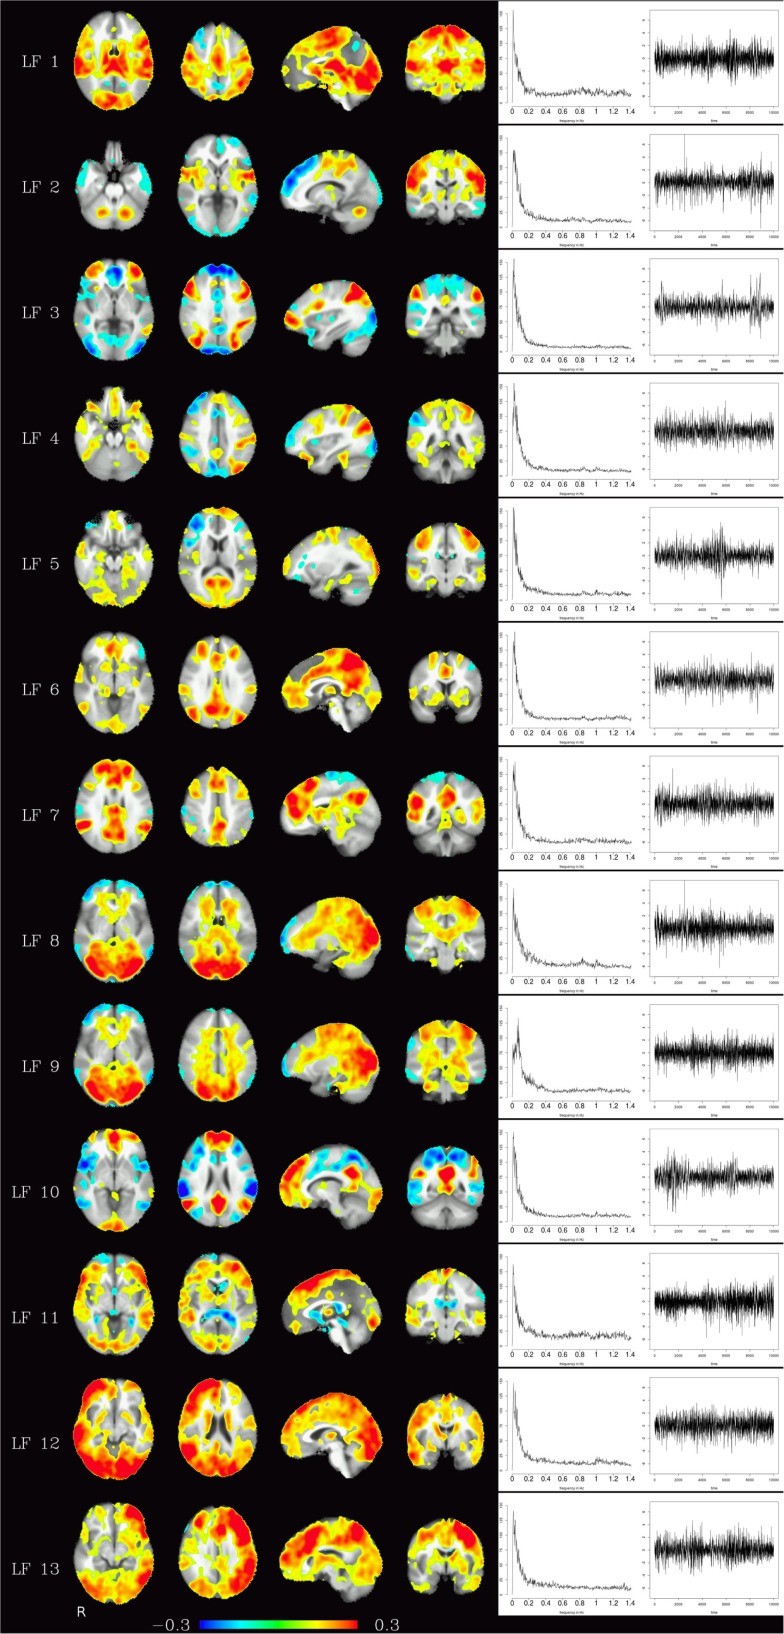
Figure 4.
Depending on the number of components chosen, various temporally independent low-frequency components (≤0.25 Hz) are separated by the algorithm (LF 1–LF 13, left row). Note that time courses and corresponding frequency spectra (right side) are not contaminated by any high-frequency components (e.g., respiration, heart-beat, etc.), increasing functional contrast-to-noise ratio. The interpretation whether a component is (predominantly) of vascular or brain tissue origin, however, is not obvious from the spectra alone.

