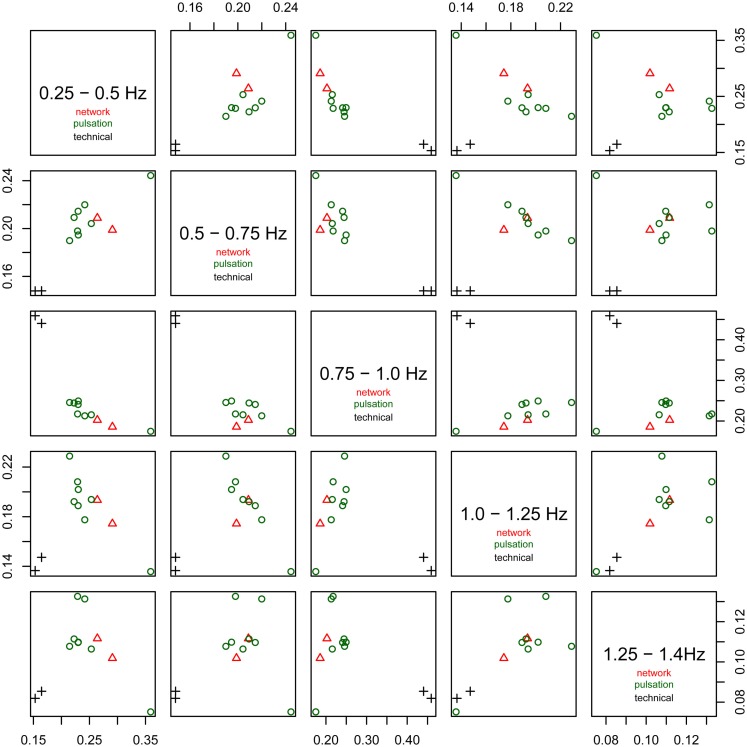
Figure 6.
Fractional amplitude of fluctuations in frequency bands 0.25–0.5, 0.5–0.75, 0.75–1.0, 1.0–1.25, and 1.25–1.4 Hz plotted against each other for all consistent tICA components. Note that technical artifacts can easily be separated from all other components in the frequency bands 0.25–0.5, 0.5–0.75, and 0.75–1.0 Hz. Components attributed to classical resting-state networks appear as mixed with pulsation components, though they tend to have higher power in the lowest frequency range, between 0.25 and 0.5 Hz, than most of the pulsation components.

