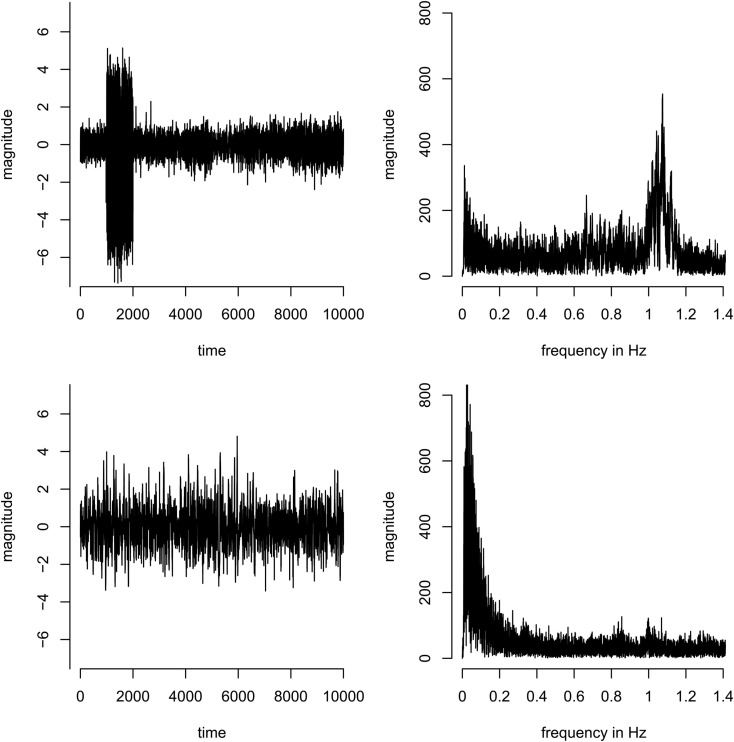
Figure A1.
Concatenated time-series (left) and corresponding spectra (right) of two example components. Top: a component dominated by a single subject – most of the variance of the time course originates from subject 2 (time points 1001–2000 in the concatenated time-series). Bottom: a component that is equally present in all subjects, i.e., the variance in the concatenated time course is more homogeneous across subjects.

