Fig. 3.
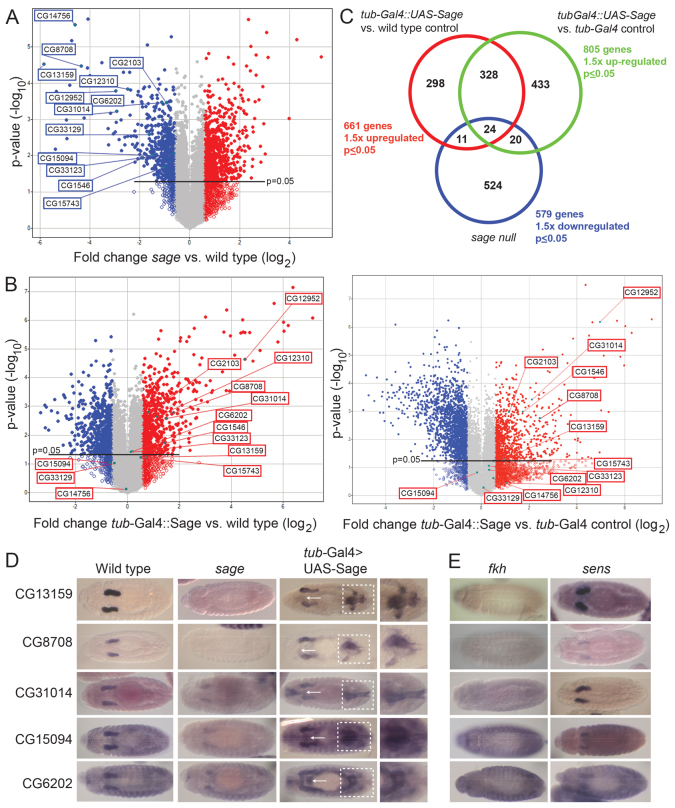
Microarray analysis of sage loss and overexpression identifies targets regulated by both Sage and Fkh. (A,B) Total RNA (100 ng) was isolated from three individual samples of stage 11-17 embryos for each genotype. Volcano plots show genes that were upregulated (red) or downregulated (blue) at least 1.5-fold (P≤0.05) in sageko embryos (A) or at least 1.5-fold (P≤0.05) in embryos in which Sage is expressed ubiquitously (tub-Gal4::UAS-Sage) (B) relative to WT (left plot) or tub-Gal4 (right plot) controls. (C) The expression of 55 genes was significantly reduced with loss of sage and significantly elevated with sage overexpression (combining comparisons with the two control sets). Using equations for a hypergeometric distribution (Blom, 1989) and Mathematica (Wolfram Research) to calculate the probability that the observed overlap in genes that are downregulated in sage nulls and upregulated with sage overexpression could occur by chance is 0.0018 for the WT control (overlap of 35 or more) and 0.00025 for the tub-Gal4 control sets (overlap of 44 or more). (D) In situ hybridization analysis confirms the regulation of target genes by Sage. Arrows indicate ectopic expression in the proventriculus when UAS-Sage is expressed using tub-Gal4 and boxed regions highlight ectopic expression in the Malpighian tubules and hindgut. (E) SG expression of Sage target genes requires Fkh and, in some cases, also requires Sens.

