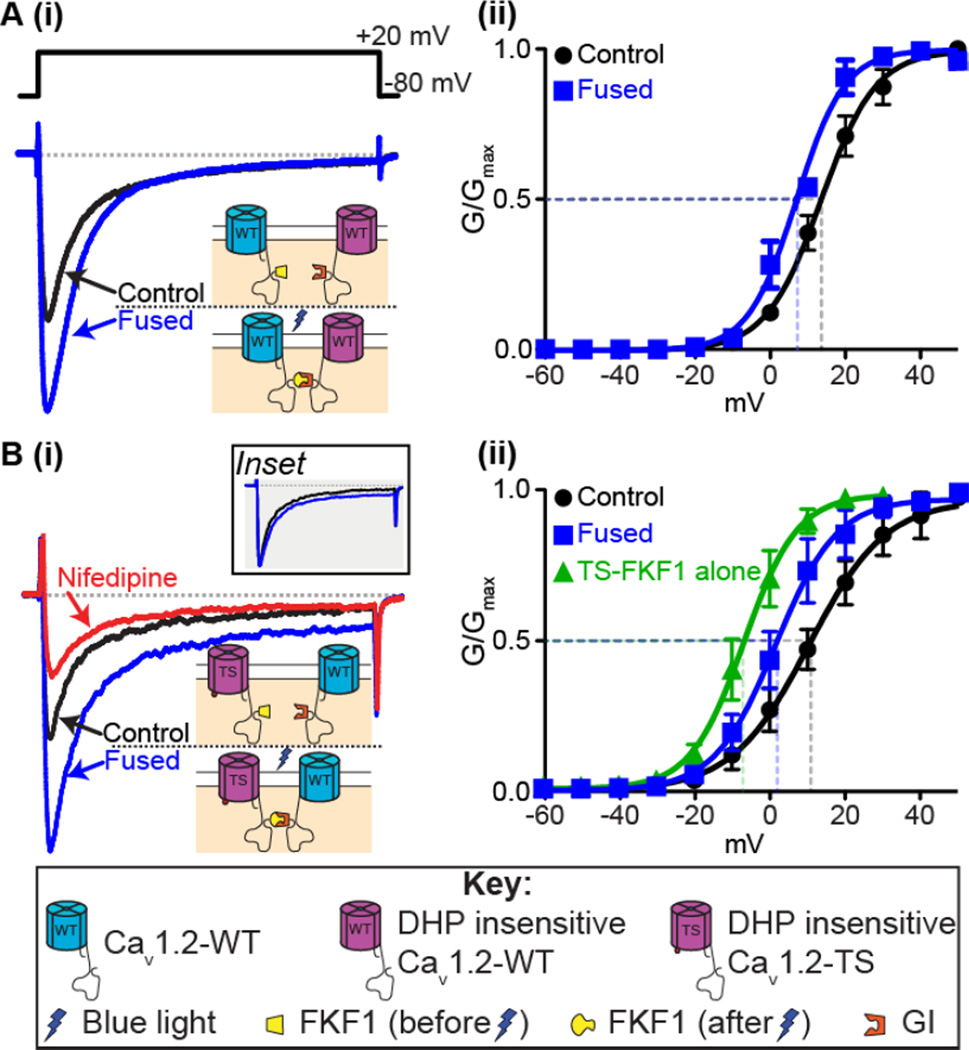
Figure 2. Fusion of CaV1.2 channels.
A: (i) Representative ICa records and (ii) voltage dependence of G/Gmax from tsA-201 cells expressing the CaV1.2-FKF1 and dihydropyridine insensitive (DHPins) CaV1.2-GI constructs before and after fusion of the C-tail tagged plant proteins upon illumination with blue light. B(i): Representative ICa records and (ii) voltage dependence of G/Gmax before and after fusion from tsA-201 cells transfected with CaV1.2DHPins-TS-FKF1 and CaV1.2-GI. An additional green trace in (ii) shows the voltage dependence of G/Gmax from tsA-201 cells transfected with only CaV1.2-TS-FKF1. Currents were elicited with a 300-ms depolarizing step to +20 mV from a holding potential of −80 mV. Illustrations of the fusion principle are shown in each instance whereby FKF1 undergoes a conformational change upon illumination with blue light rendering it capable of binding to GI and forcing physical interaction of the channels. Inset in B(i) compares the non-inactivating component when the control ICa trace was scaled up to match the peak ICa after fusion. Notice that the increase in the non-inactivating component is non-scalar. Conductance (G) was normalized to the maximum conductance (Gmax) and fitted with Boltzmann functions. Modified from Dixon et al. 2012.

