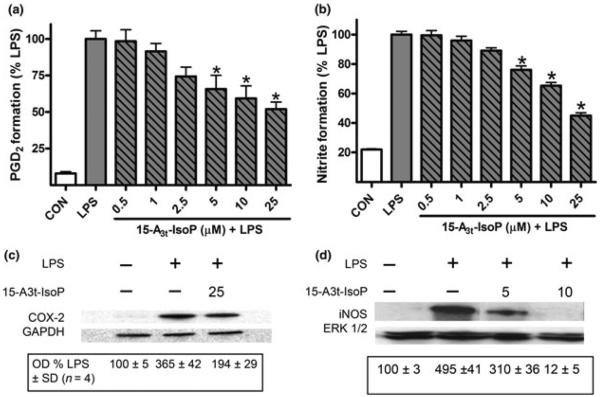
Fig. 2.
15-A3t-IsoP inhibits LPS-induced production of inflammatory mediators in RAW264.7 macrophages. RAW264.7 macrophages were pre-incubated with varying concentrations of 15-A3t-IsoP for 30 min and then stimulated with LPS (1 μg/mL) for 24 h in the presence of 15-A3t-IsoP. A, 15-A3t-IsoP inhibits LPS-induced PGD2 production, the primary product of COX-2 activity in macrophages, as quantified by GC/MS. B, 15-A3t-IsoP inhibits LPS-induced production of nitrite, a stable metabolite of iNOS activity, as quantified by Griess assay. Assays were performed 24 h after the initiation of the pre-incubation period. Statistical analysis of PDG2 (a) and nitrate formation (b) were performed using a two-tailed between group anova and demonstrated a significant treatment effect with p < 0.01. Post hoc analysis using Tukey's HSD post hoc testing revealed control versus LPS p < 0.001 for both Fig. 2A and B. Asterisks are used to denote statistically significant effects of 15-A3t-IsoP + LPS compared to LPS alone. All data represent mean ± SD of four separate experiments carried out in triplicate where data were normalized to the protein concentrations of samples. (c, d) 15-A3t-IsoP (5, 10, and 25 μM) inhibits LPS-induced expression of the proteins COX-2 after 6 h of LPS stimulation (c) and iNOS after 9 h of LPS stimulation (d) as analyzed by western blot. GAPDH and ERK blots are shown as loading controls. Blots in panels (c) and (d) are representative of four independent experiments. Semi-quantitative densitometric analysis of the blots was performed using Image J and data shown are the optical densities (OD) for each condition ± SD where the first lane is taken as a baseline value of 100%.

