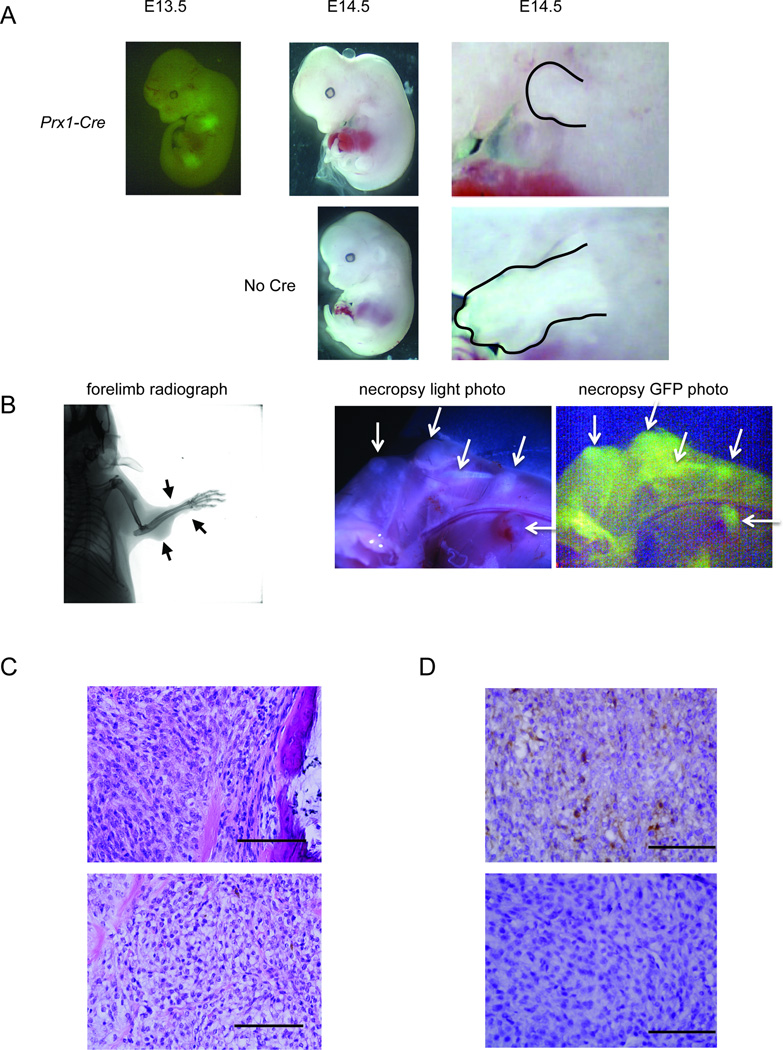
Figure 5. EWS-ATF1 drives apoptosis in the embryonic Prx1-lineage and tumorigenesis in the post-weaning Prx1-lineage.
(A) GFP fluorescence image of Prx1-Cre;Rosa26EA1 embryos at embryonic day 13.5 (far left). Prx1-Cre;Rosa26EA1 at E14.5 (top middle), compared to littermate controls lacking Prx1-Cre (bottom middle), the limbs of mutant and control are enlarged to show difference in size (outlined in right panels) (B) Radiograph of a Prx1-CreERT2;Rosa26EA1 mouse 8 weeks after a single tamoxifen injection at 4 weeks of age (left), gross necropsy photos with halogen light (middle) or GFP fluorescence (right) of Prx1-reERT2;Rosa26EA1 limb 8 weeks post tamoxifen injection (arrows point to tumors). (C) H&E stained histolopathology of Prx1-reERT2;Rosa26EA1 tumor immediately adjacent to bone (upper) and tumor exhibiting classic clear cell sarcoma morphology (lower). (D) Immunohistochemistry for M-MITF on Prx1-CreERT2;Rosa26EA1 derived tumors. Scale bars are 100 µm in length.

