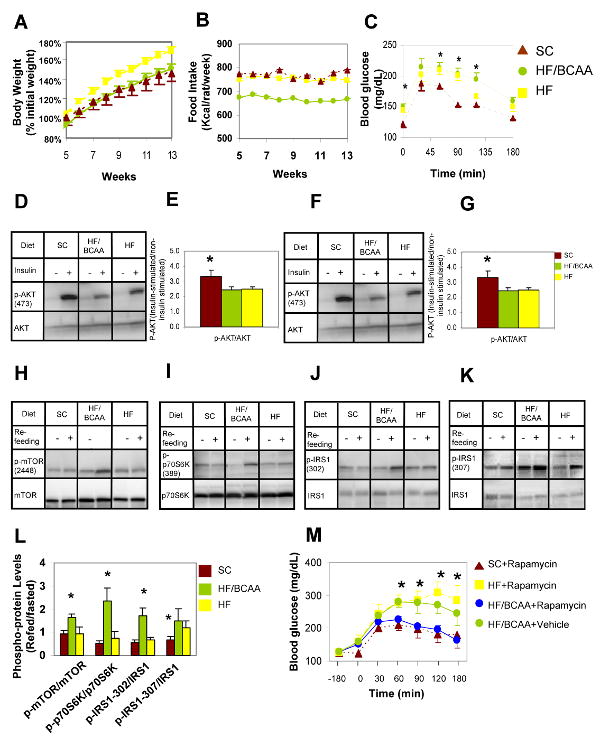
Figure 2. Effects of BCAA supplementation on body weight, food intake, and insulin signaling.

Rats were fed on standard chow (SC), high fat (HF) or HF supplemented with BCAA (HF/BCAA) diets for 12-16 weeks. A) Body weight expressed as % of initial weight; B) Food intake expressed as Kcal/rat/week. Data for panels A and B represent 5-9 animals per group. In panel A, HF was different from both the SC and HF/BCAA groups at all time points, with p < 0.036. In panel B, HF/BCAA was different from both the SC and HF groups at all time points, with p < 0.006. C) Intraperitoneal glucose tolerance test; n = 5-9 rats/group. (*) the SC group was different from the other two groups, with p < 0.036; D) Representative immunoblot of p-AKT levels in skeletal muscle 30 minutes after an acute insulin bolus in overnight fasted rats; E) Quantitative summary of muscle p-AKT studies, expressed as ratio of insulin stimulated: non-insulin stimulated conditions and normalized to total AKT protein; F) Representative immunoblot of p-AKT levels in liver, 30 minutes after an acute insulin bolus in overnight fasted rats; G) Quantitative summary of liver p-AKT studies, expressed as ratio of insulin stimulated: non insulin-stimulated conditions and normalized to total AKT protein levels. For panels E and G, (*) indicates that SC-fed animals had higher levels of p-AKT than the other two groups, with p < 0.033; H) p-mTOR2448, representative immunoblot; I) p-P70S6K1389, representative immunoblot; J) p-IRS-1ser302, representative immunoblot; K) p-IRS1ser307, representative immunoblot; L) Quantitative summary of phosphoproteins normalized to total levels of mTOR, p70S6K1, or IRS-1, respectively. Data in H-L are for skeletal muscle samples from 3-5 animals/group fed on the three diets, fasted for 48 h and then refed on the same diets for 4 h. (*) in panel L indicates higher levels of phosphoproteins in the HF/BCAA group compared to the other two groups, with p < 0.05; M) Rapamycin treatment reverses insulin resistance in HF/BCAA-fed but not HF-fed rats. Data shown are for 5-7 animals per group. (*) p < 0.05, blood glucose significantly different between the HF-fed, rapamycin treated or HF/BCAA-fed, non treated groups versus the SC, rapamycin treated and HF/BCAA, rapamycin treated groups.
