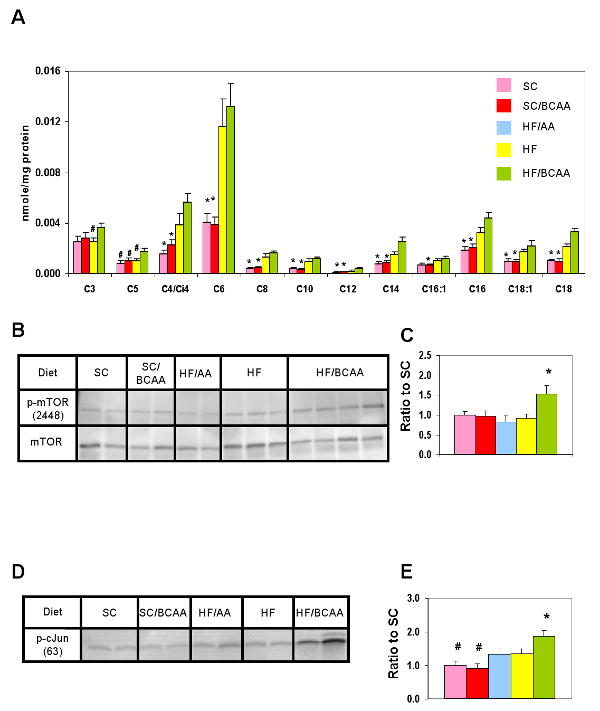
Figure 4. BCAA supplementation of HF diet causes accumulation of acylcarnitines in skeletal muscle and chronic activation of mTOR and JNK.

A) Skeletal muscle samples were collected from animals fed on the indicated diets and used for acylcarnitine analysis by MS/MS. Data represent the mean ± SEM for 6 animals per group. (*) p < 0.05 for comparison of SC and SC/BCAA to HF and HF/BCAA groups. B) Representative p-mTOR2448, immunoblot in muscle from overnight fasted SC, SC/BCAA, HF, HF/AA, and HF/BCAA-fed rats; C) Quantitative summary of p-mTOR2448 analyses; D) Representative p-cJUNser63 immunoblot in muscle from the same sets of animals studied in panel B; E) Quantitative summary of p-cJUN analyses. (*) p < 0.05 for comparison of HF/BCAA to the other groups. (#) p<0.05 for comparison of SC and SC/BCAA to the other groups. In panels C and E, n = 6-9 animals/group.
