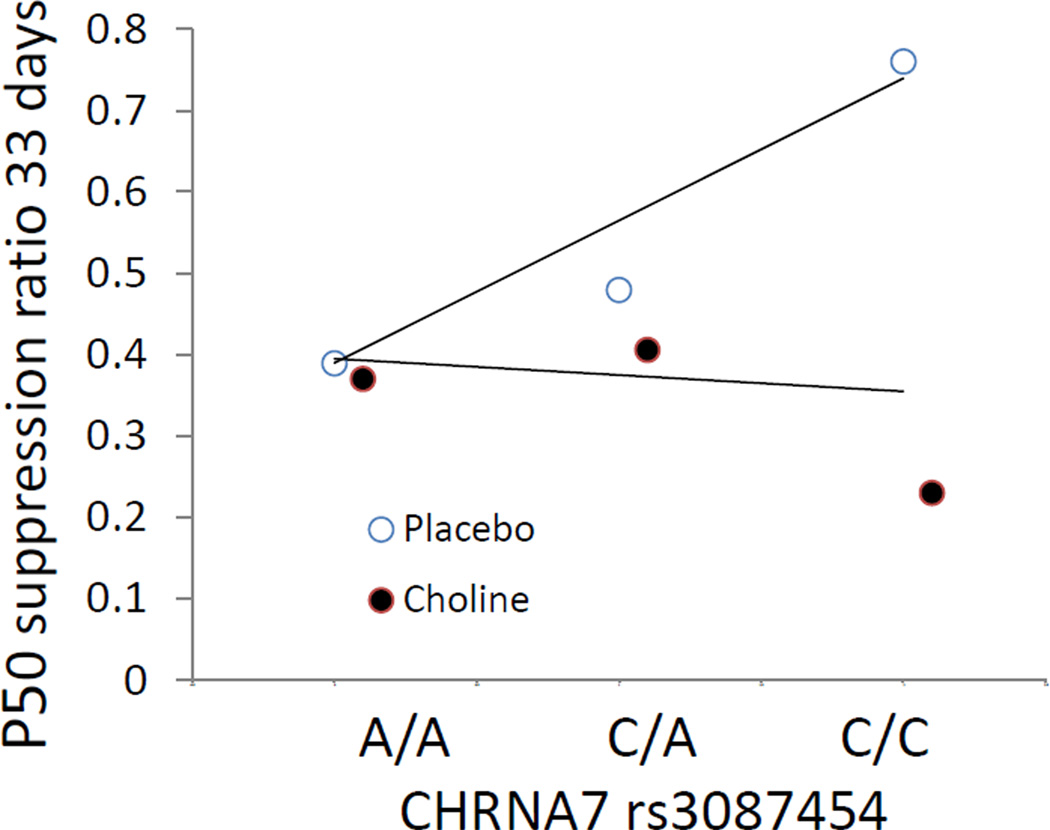
Figure 3.
Regression of P50 ratio on infant CHRNA7 genotype. Mean values are shown; individual values are shown in Figure S3. The placebo-treated infants showed a significant correlation of P50 ratio with rs3087454 (rs = 0.38, df 30, P = 0.032, dashed line). There was no significant correlation for the choline-treated infants (solid line).

