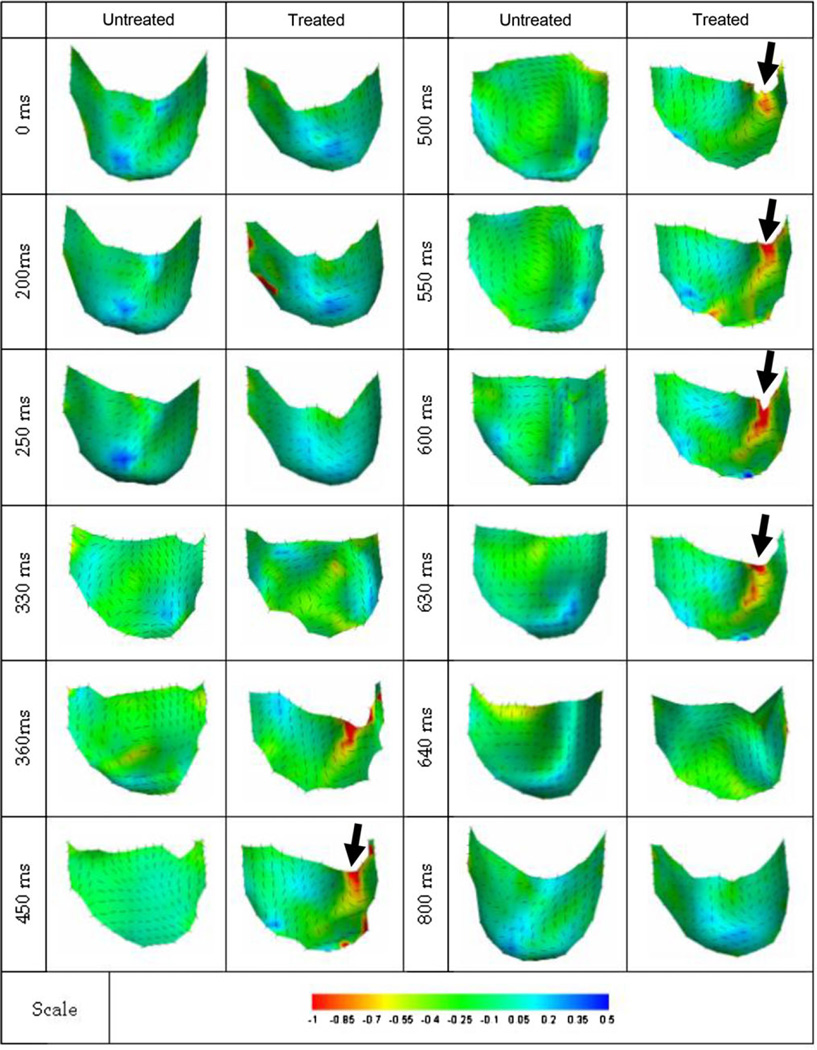
FIGURE 6.
Plot of native and BHV leaflet surface showing the minor principal curvature bII (in mm−1) over a complete simulated cardiac cycle. Note for native leaflet, the location of high curvature shifts during cycle, where as the BHV leaflet remains the same. Region of high curvature in the BHV leaflet (arrow) occupied approximately 10% of the total leaflet surface.

