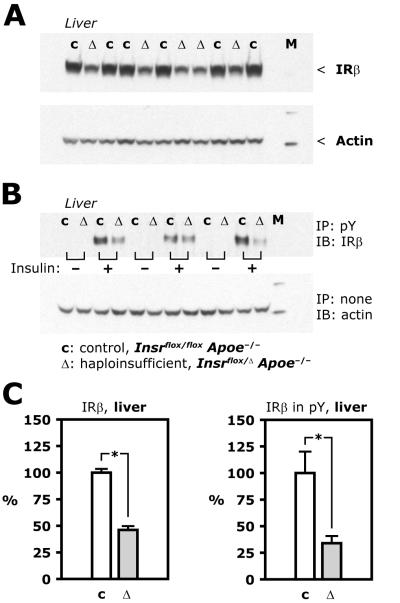
Figure 1. Insulin receptor expression and tyrosine phosphorylation in liver.
A, Representative Western blots based on lysate of liver from control (c) and haploinsufficient (Δ) mice (Insr flox/ flox Apoe−/− and Insr flox/Δ Apoe−/−, respectively). M, molecular weight marker. B, Insulin (50 mU/g) or insulin diluent was injected in the vena cava during pentobarbital anesthesia. After 5 minutes, organs were isolated and flash frozen. Representative Western blots based on phospho-tyrosine immunoprecipitates from liver lysate using tissue from control (c) and haploinsufficient (Δ) mice. C, Average values from 6 control and 5 haploinsufficient animals (left) and from 6 control and 6 haploinsufficient animals (right).

