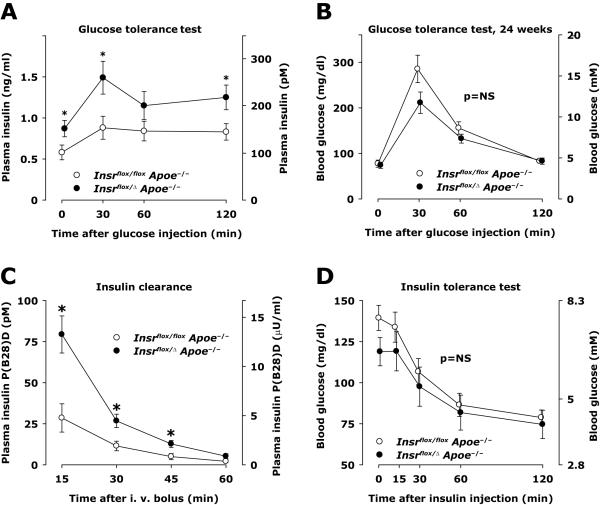
Figure 3. Glucose and insulin tolerance, insulin production and clearance.
A and B, Glucose tolerance tests were performed in 10 control and 10 haploinsufficient mice (Insr flox/ flox Apoe−/− and Insr flox/Δ Apoe−/−, respectively) in the morning after an overnight fast. D-glucose 2 mg per gram body weight was injected intraperitoneally. Capillary blood was sampled from a tail cut and analyzed immediately for glucose concentration. Heparinized plasma was analyzed for insulin concentrations by ELISA. C, Insulin aspart (containing a P(B28)D mutation) at a dose of 0.5 mU/g was injected intravenously in the random fed state. Capillary blood was sampled from a tail cut and heparinized plasma was analyzed by an ELISA without cross-reactivity to endogenous insulin. D, Insulin tolerance test performed in the random fed state using intraperitoneal injection of insulin (0.6 mU/g).

