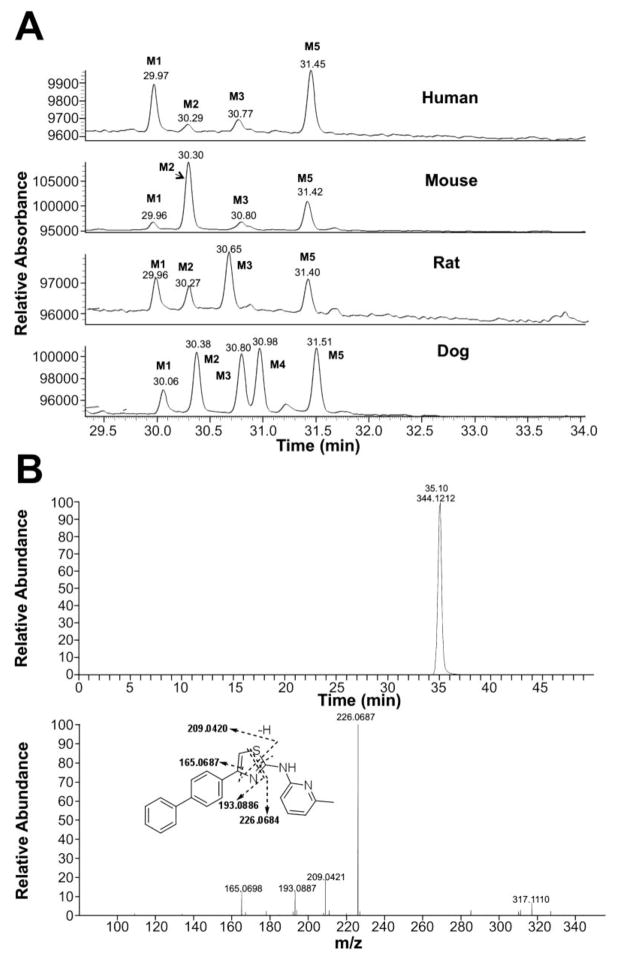
Fig. 2.
Metabolic profile (UV chromatogram at 268 nm) of IND24 in human, mouse, rat, and dog liver microsomal incubations (a). The parent drug is not shown in the chromatogram. Metabolites M2, M3, and M4 had the same mass spectrum as depicted in Table VI. Extracted ion chromatogram and mass spectrum of unchanged IND24 following liver microsomal incubations (b).

