
Table V.
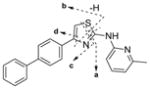
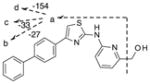
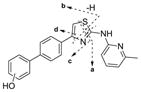
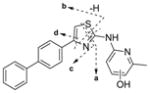
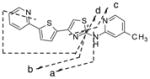
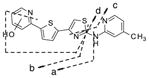
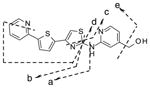
Observed (Obs.) and Calculated (Calc.) Molecular Ions And Mass Spectral Fragment Ions of IND24 and its Metabolites (top panel), and IND81 and its Metabolites (bottom panel) Following Incubation With Human, Mouse, Rat, and Dog Liver Microsomes
| Metabolite | Structure | Molecular Ions | Fragment Ions | |||||
|---|---|---|---|---|---|---|---|---|
|
| ||||||||
| MH+ | a | b | c | d | e | |||
| Parent IND24 |
|
Obs. | 344.1212 | 226.0687 | 209.0421 | 193.0887 | 165.0698 | |
| Calc. | 344.1216 | 226.0684 | 209.0420 | 193.0886 | 165.0687 | |||
| M1 |
|
Obs. | 360.1162 | 342.1060 | 35.0951 | 309.1262 | 161.0167 | |
| Calc. | 360.1165 | 342.1059 | 315. 0950 | 309.1260 | 6.0167 | |||
| M2/M3/M4 |
|
Obs. | 360.1158 | 242.0634 | 225.0369 | 209.0835 | 181.0647 | |
| Calc. | 360.1165 | 242.0634 | 225.0363 | 209.0835 | 181.0647 | |||
| M5 |
|
Obs. | 360.1160 | 226.0686 | 209.0421 | 193.0886 | 65.0698 | |
| Calc. | 360.1165 | 226.0684 | 209.0420 | 193.0886 | 165.0687 | |||
| Parent IND8 |
|
Obs. | 351.0729 | 243.0048 | 233.0205 | 218.0096 | 206.0095 | |
| Calc. | 351.0732 | 243.0039 | 233.0202 | 218.0092 | 206.0092 | |||
| M1/M3 |
|
Obs. | 367.0680 | 258.9997 | 249.0154 | 234.0045 | 222.0045 | |
| Calc. | 367.0681 | 258.9988 | 249.0150 | 234.0042 | 222.0041 | |||
| M2 |
|
Obs. | 367.0679 | 243.0048 | 233.0204 | 218.0095 | 206.0094 | 349.0576 |
| Calc. | 351.0732 | 243.0039 | 233.0202 | 218.0092 | 206.0092 | 349.0579 | ||