
Figure 2.
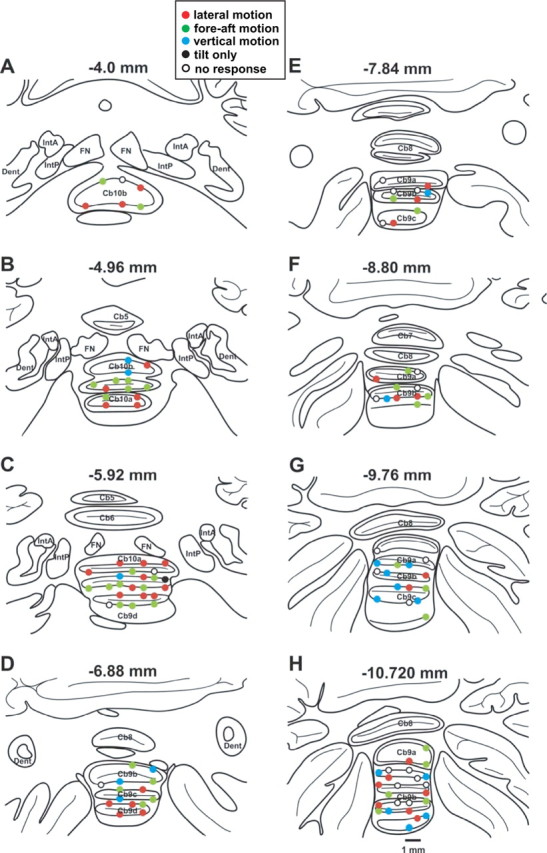
Histological reconstruction of Purkinje cells. A–H, Drawings of coronal sections (80 μm thickness, shown every 12 slices) through the cerebellar nodulus (lobule 10, Cb10) and uvula (lobule 9, Cb9) of animal F, laid out from rostral (A) to caudal (H). Reconstruction of recordings from all animals were plotted over the coronal sections of animal F. Filled circles: CSs showing significant vestibular modulation (n = 93); open circles: CSs without vestibular modulation (n = 22; note that because most neurons were only tested during translation in the horizontal plane, some of the “nonresponsive” cells might in reality be “vertically preferring neurons”). Data have been color coded according to the translation direction (lateral, fore-aft, or vertical) with the largest response modulation. Red fill: CSs with maximum modulation during lateral motion (n = 38); green fill: CSs with maximum modulation during fore-aft motion (n = 35); cyan fill: CSs with maximum modulation during vertical motion (n = 19, note that only a subpopulation of cells was tested during vertical translation). Finally, black-filled circles illustrate CSs with significant modulation only to tilt, not translation (n = 1). Numbers on top of each panel correspond to distance from the abducens nucleus. Anatomical structures and lobules were identified according to Madigan and Carpenter (1971) and Paxinos et al. (2000). FN, Fastigial nuclei; IntA, interpositus anterior; IntP, interpositus posterior, Dent, dentate.