
Figure 4.
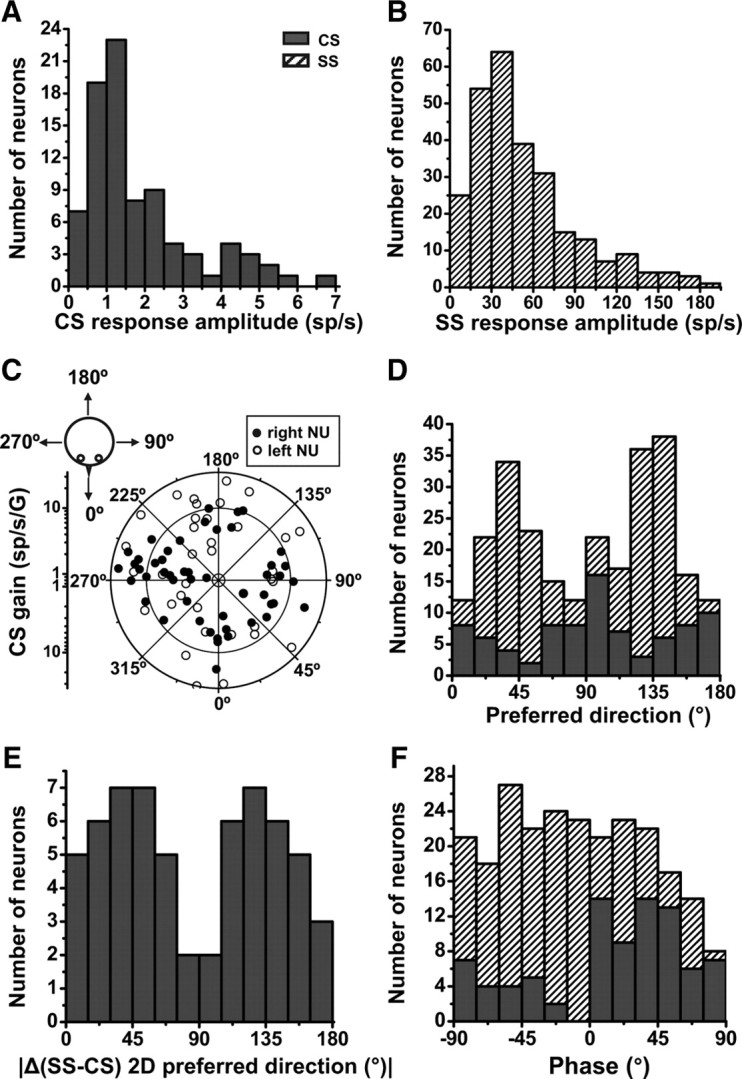
Spatial organization of CSs and SSs during translation (0.5 Hz) in the horizontal plane. A, B, Distributions of response amplitudes [from sinusoidal fit; units are spikes per second (sp/s)] along the maximum response direction for CSs (n = 85) and SSs (n = 269), respectively. C, Polar plot illustrating preferred direction gain (in units of spikes/s/G) and orientation (see drawing, upper left). Each data point corresponds to one Purkinje cell (CS) that shows significant modulation (p < 0.01) during at least one direction (lateral or fore-aft, n = 85). Note that translation responses are not lateralized in the NU; i.e., there is no obvious difference in the preferred direction distribution for cells recorded in the right (filled symbols) versus left (open symbols) NU. D, Stacked bar plot of the distributions of translation preferred directions for both CSs (n = 85, filled bars) and SSs (n = 269, hatched bars). E, Distribution of preferred direction difference between CSs and SSs, |Δ(CS-SS), 2D preferred direction| (computed only for the CS/SS pairs that were confirmed to arise from the same Purkinje cell; n = 61). F, Distribution of CS (filled bars) and SS (hatched bars) response phase during 0.5 Hz sinusoidal translation along the preferred direction (n = 85).