
Figure 6.
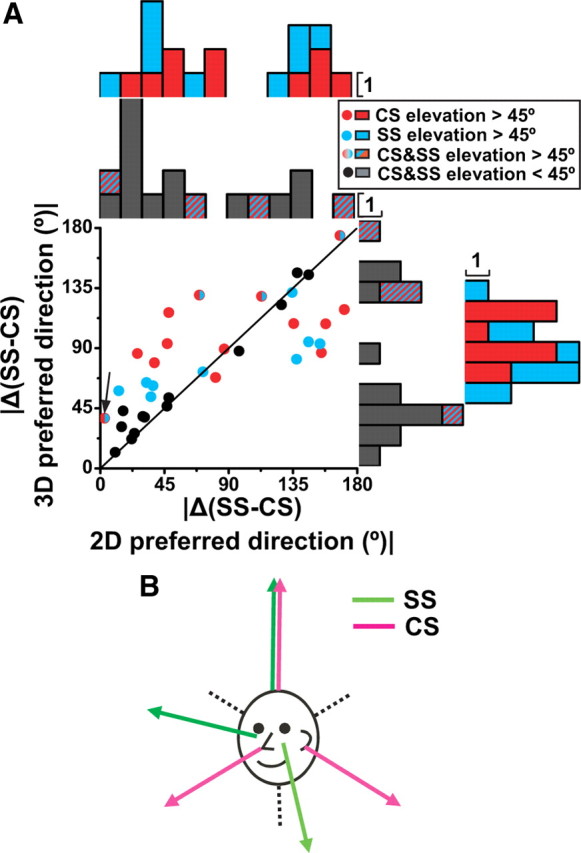
Preferred direction difference between CS and SS during translation. A, Relationship between the 3D and 2D (horizontal plane) CS-SS preferred direction difference, where the |Δ(CS-SS) 3D preferred direction| is plotted versus |Δ(CS-SS) 2D preferred direction|. Each data point corresponds to a NU Purkinje cell with significant translation responses for both CSs and SSs (n = 36), color coded according to whether either CS (red) or SS (blue) has 3D preferred direction with |elevation| >45° (as in Fig. 5B) (cells for which both CSs and SSs have |elevation| >45° are shown in mixed red/blue). Purkinje cells for which both CSs and SSs have |elevation| <45° are shown as black dots. Arrow marks the cell of Figure 5A. Histograms along the abscissa and ordinate show marginal distributions plotted separately for cells with either one |elevation| >45° (red and blue) and both |elevation| <45° (black) or both |elevation| >45° (mixed red/blue). B, Drawing summarizing the coordinate systems for CS (magenta) and SS (green) preferred directions.