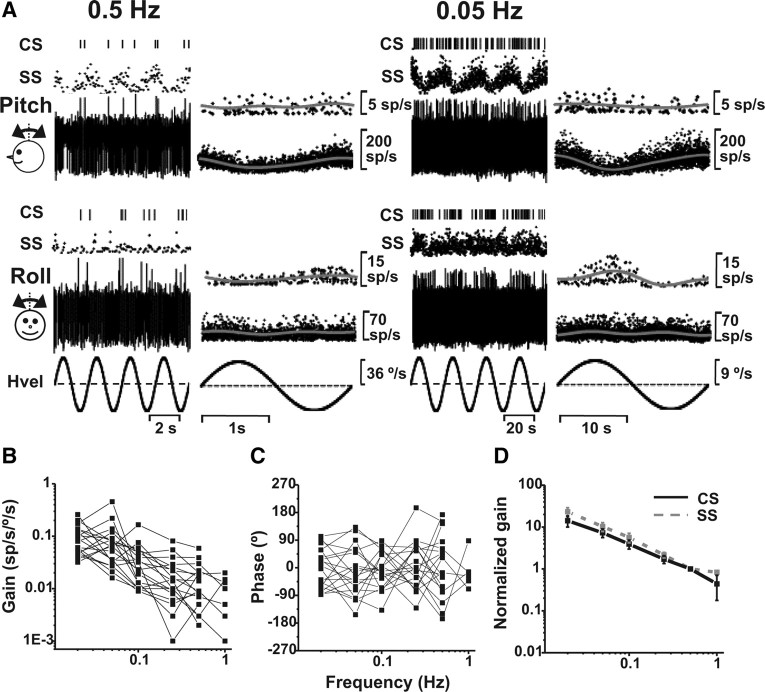
Figure 8.
CS response dynamics during tilt. A, Examples of CS and SS responses from the same Purkinje cells during pitch (top) and roll (bottom) at 0.5 (left) and 0.05 Hz (right). Data are shown as raw spikes, discriminated CSs, or instantaneous firing rate (see Fig. 3 legend). B and C, CS gain (B) and phase (C) (expressed relative to angular velocity) are plotted as a function of frequency (n = 19). D, Normalized gains are shown for both CSs (black solid line) and SSs (gray dashed line). Gains have been normalized by dividing each gain value by the cell's 0.5 Hz gain before the calculation of the average.

