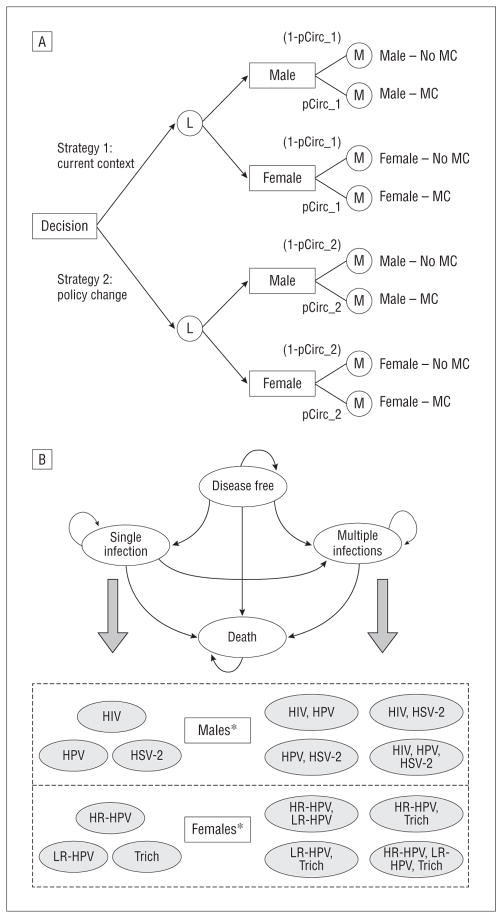
Figure.
Markov-based model structure and bubble diagram. A, First, a decision node leads to a strategy choice, in which strategy 1 is defined by the current male circumcision (MC) rate and strategy 2 is defined by a decreased MC rate. Individuals are separated by sex using a logic node (L) and enter 1 of 2 Markov processes (M). The 2 processes involve identical states but differ in MC-dependent parameters. The probability of running through an MC process is defined by the MC rate under the selected strategy, with males experiencing the MC procedure and subsequent health benefits and with females experiencing protective benefits of MC from associating with circumcised males. B, Males and females transition through separate models, each beginning in a “disease-free” state. During each 1-year cycle of the simulation, individuals may remain in their current state or transition to another possible state, acquiring a single infection or multiple infections at once. HIV indicates human immunodeficiency virus; HR-HPV, high-risk human papillomavirus; HSV-2, herpes simplex virus type 2; LR-HPV, low-risk human papillomavirus; pCirc, probability of MC protection under the given strategy; trich, trichomoniasis. *Infant male urinary tract infections and female bacterial vaginosis were incorporated but not modeled as separate Markov states.

