
Figure 10.
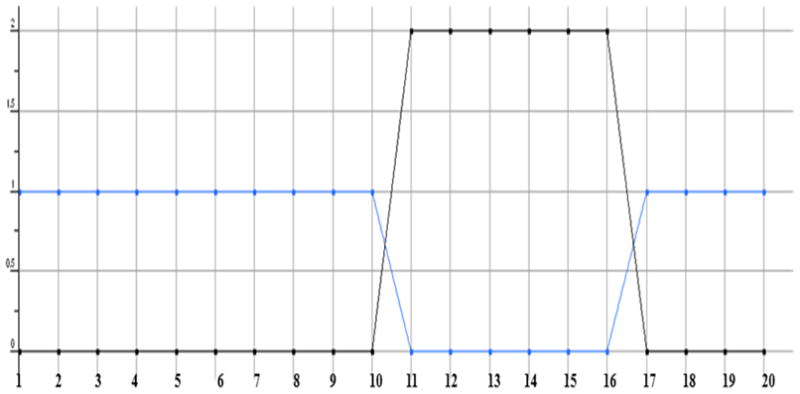
Plot showing the Lipinski rule drug like (blue) and violation (black) of test compounds. The blue colored line with a value of 1 shows the drug likeliness and value of beyond 0 indicates the Lipinski rule violation. The compounds 11, 12, 13, 14, 15 and 16 are showing violations of 2 each.