
Figure 15.
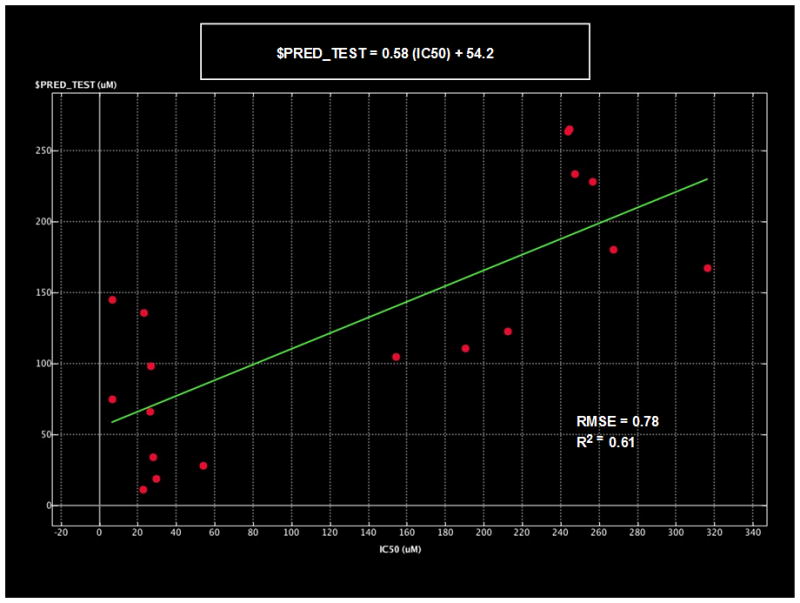
Linear correlation graph comparing a independent test set of measured IC50’s with predicted values based on the calculated 2D QSAR model. The linearity of the test model is shown with the values of the error (RMSE) and correlation factor (R2).