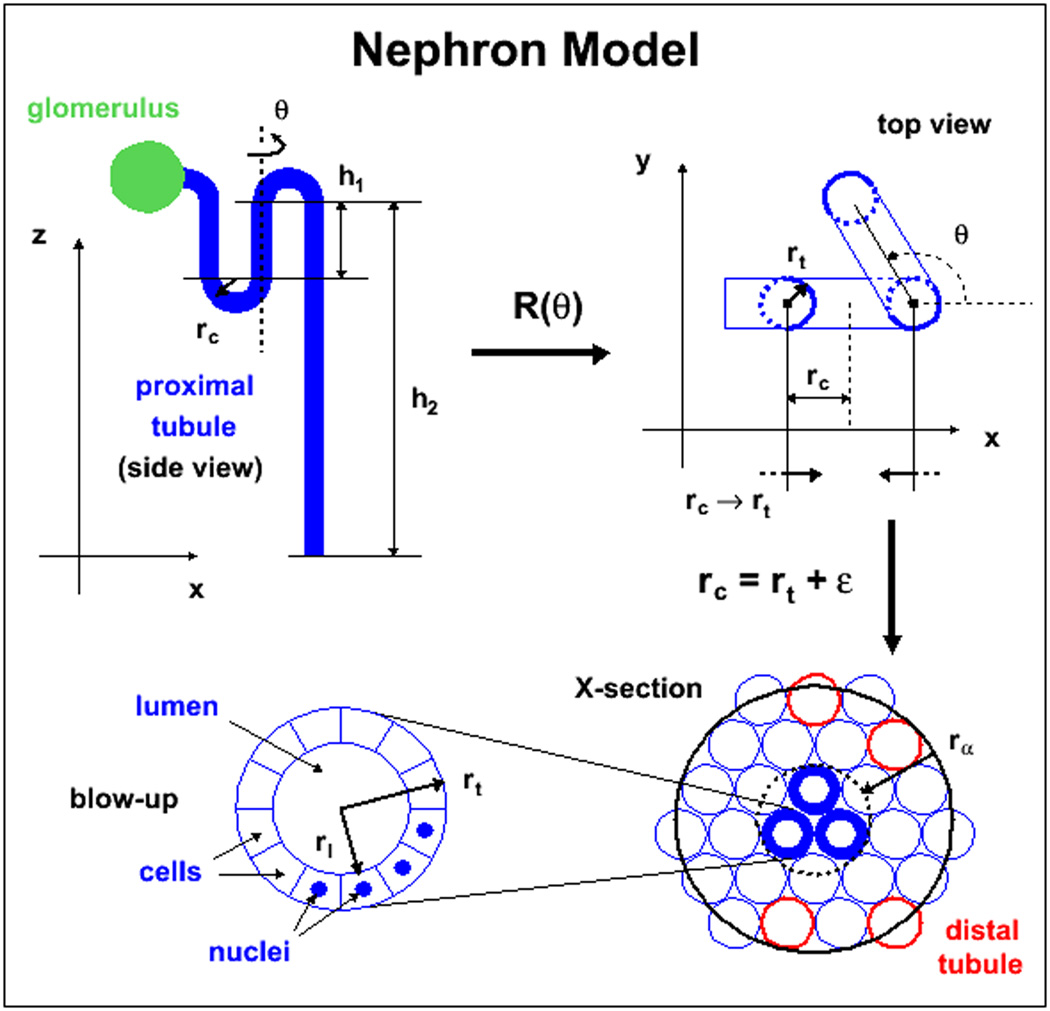
Figure 1.
Idealized geometrical nephron model. The parameters shown are those used for the simulation: rt is the proximal tubule radius, rl is the lumen radius as measured by histology. The ε value is taken to be 1µm and corresponds to interstitial space, h1 and h2 represent the scale of the proximal tubule length.

