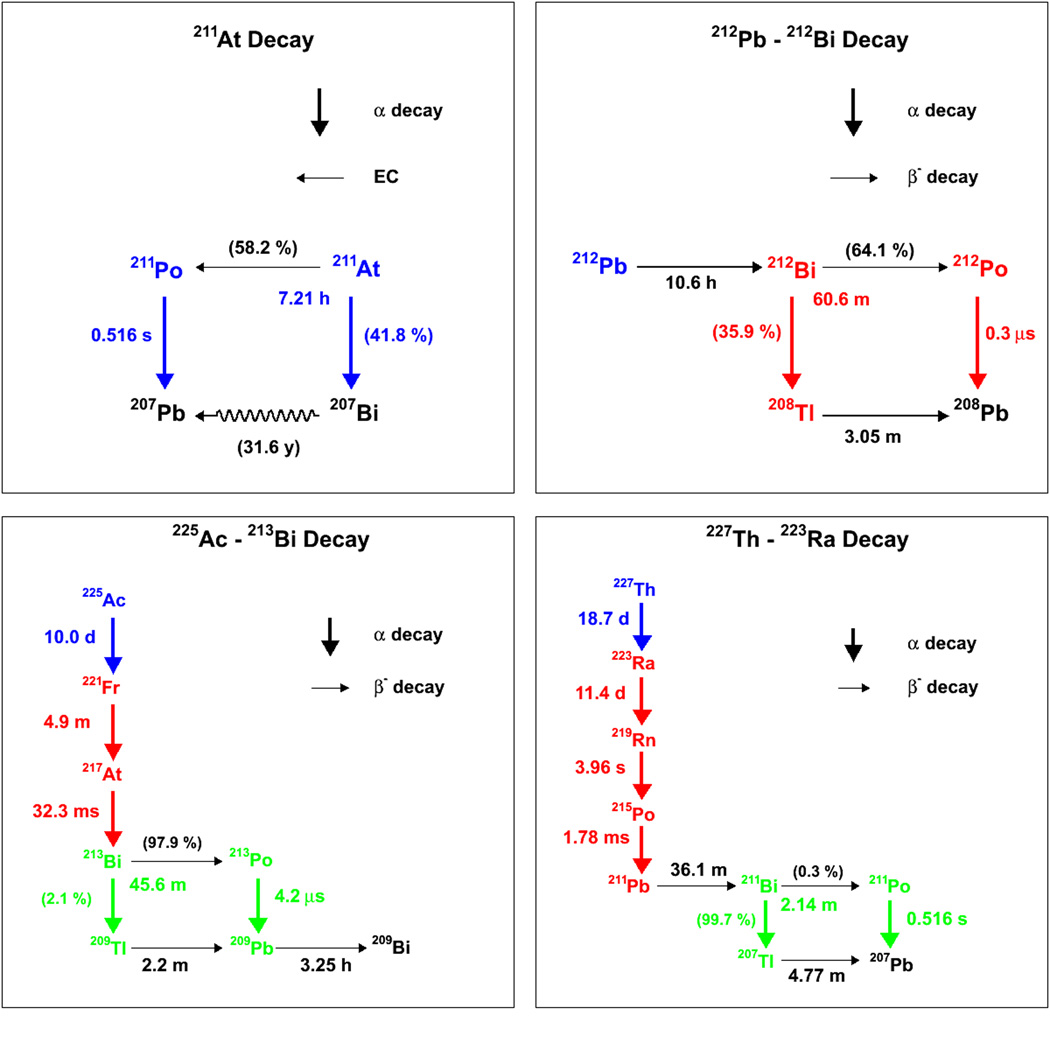
Figure 3.
Decay schemes for currently used α-emitting radiopharmaceuticals. Within each figure, the decays shown in a same color are considered as a single S-value because of the short half-life of the descendants. In figure 3a, the long half-life of 207Bi precludes it from contributing to therapeutic absorbed dose and is thus represented as a squiggly line.

