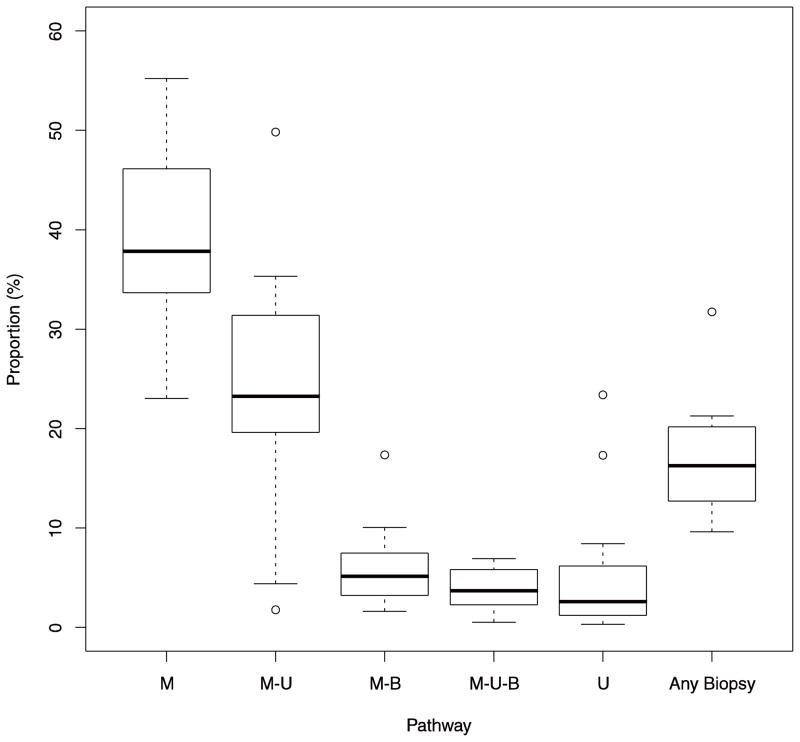
Fig. 1. Variability in use of diagnostic pathways across Breast Cancer Surveillance Consortium facilities.
The upper and lower boundaries of each box represent the 75th and 25th percentiles of the distribution of the proportion of BI-RADS 0 screening mammograms receiving a particular work-up pathway. Heavy lines at the center of the box represent the median of the distribution. Whiskers represent the most extreme outliers within 1.5 times the interquartile range of the boundaries of the box. Individual points are facilities lying outside this range. M = mammogram, U = ultrasound, B = biopsy

