
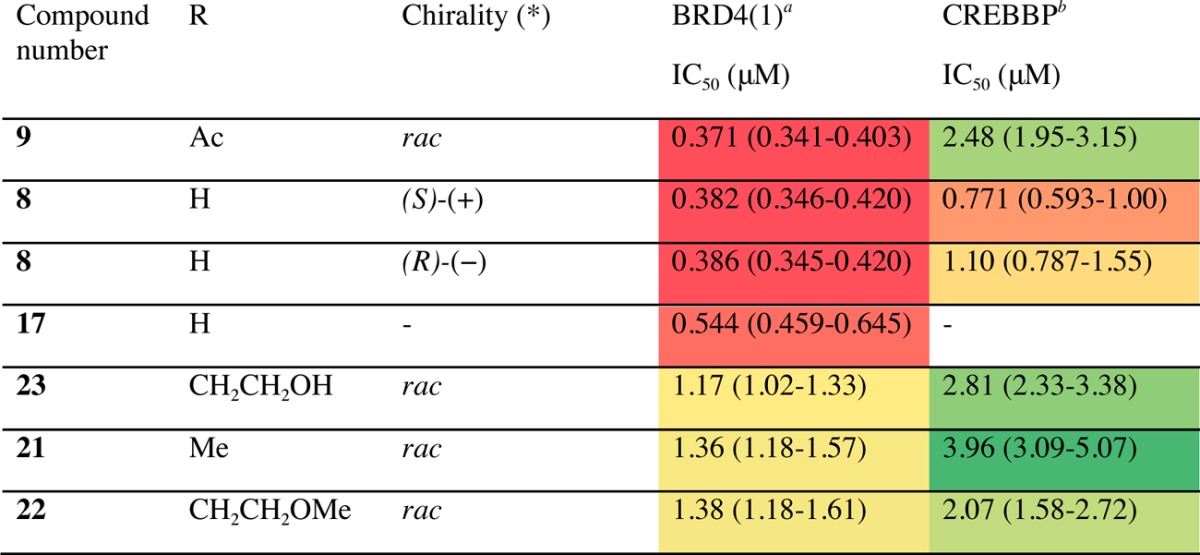
Table 2. IC50 Values of Compounds 8, 9, 17, 21–23 against BRD4(1).
a
Protein and peptide concentration: 50 nM.
b
Protein and peptide concentration: 50 nM. Heat map shows relative IC50 values obtained in an ALPHA assay.30 Red indicates low IC50 values, and green/yellow indicates high IC50 values. Ranges in parentheses represent 95% confidence intervals resulting from sigmoidal curve fitting to duplicate data.