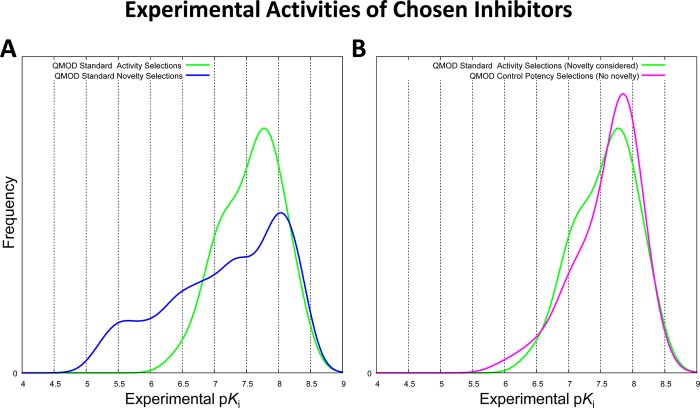
Figure 6.
(A) Distribution of experimentally measured activity for the QMOD standard procedure, comparing the 40 molecules chosen based on predictions of high activity (green curve) and the 40 molecules chosen based on structural novelty (blue curve). (B) Comparison between the QMOD standard procedure (green curve) and the control procedure (magenta curve), which made selections based solely on activity predictions.

