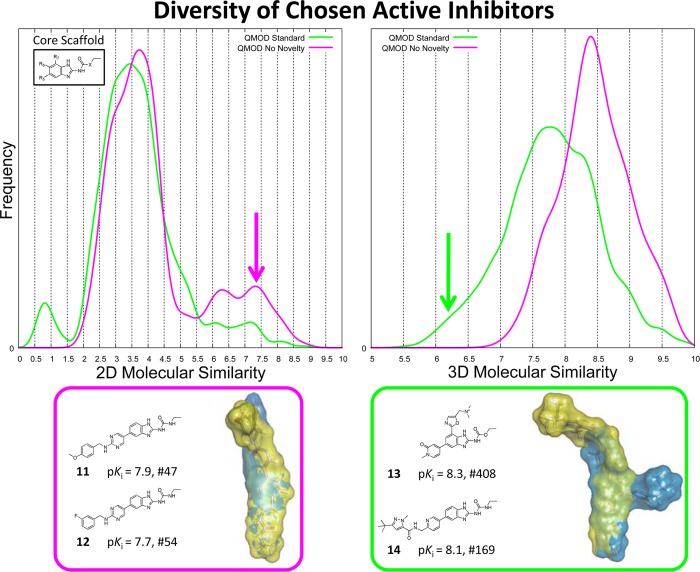
Figure 9.
Structural diversity among the molecules selected using the QMOD procedure that included an active novelty component was significantly higher in both 2D (left) and 3D (left). At bottom, example pairs of molecules are given from the control procedure (left) and the standard procedure (right). This comparison considered all molecular selections from each procedure, whether derived from an activity prediction or one from novelty, a total 80 molecules each for the standard procedure and the control procedure.

