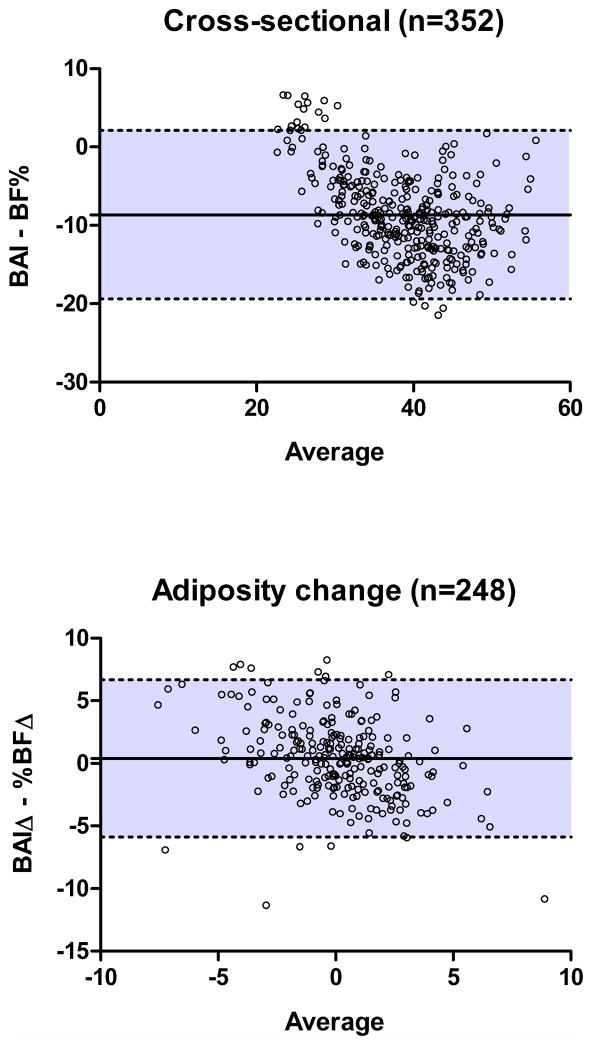
Figure 1.
Bland-Altman plots depicting cross-sectional agreement between BAI and %BF at Fat Patterning Study Baseline (top) and agreement between BAIΔ and %BFΔ over an average of 1.6 (SD=0.7) years of follow-up (bottom). Plots show the mean and 95% confidence intervals of the differences between measures across the distribution of scores.

