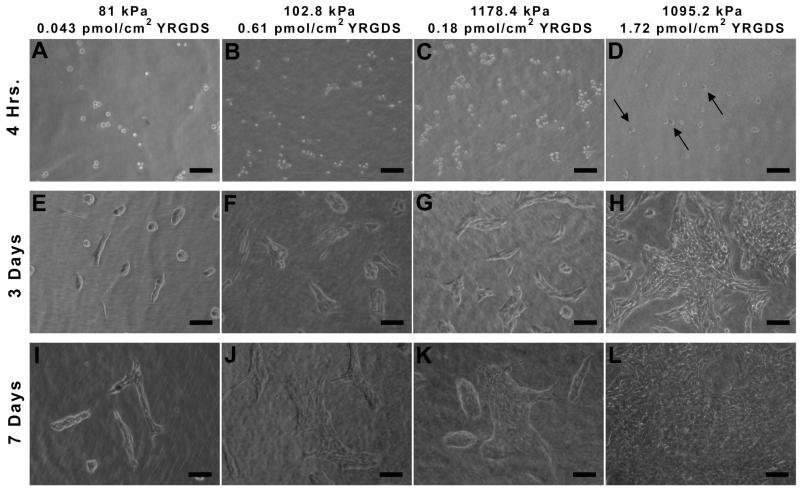
Figure 7.
Phase contrast images of 3T3 fibroblast adhesion and proliferation over time on PEGDA scaffolds with varying elastic modulus and immobilized concentrations of the YRGDS adhesion ligand. Arrows in D indicate cells that are fully spread and have taken on a flat morphology (10× magnification; scalebar = 100 μm).

