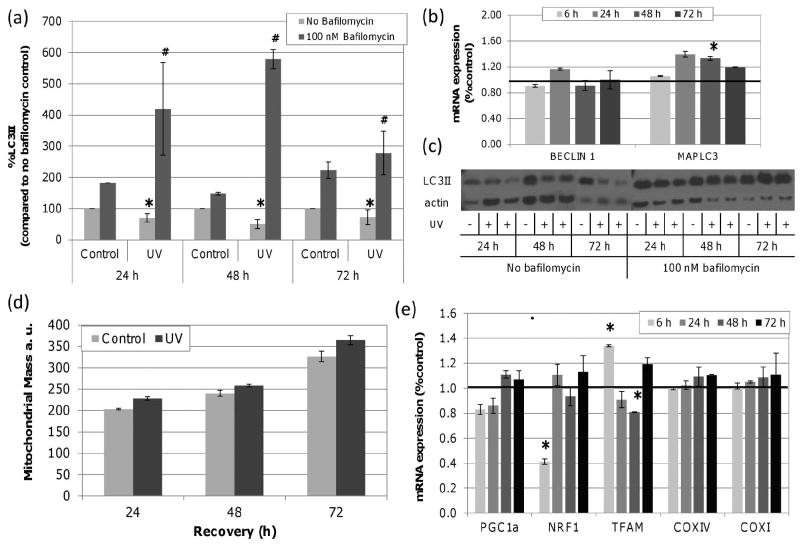
Figure 2. UVC exposure increases LC3II formation without changes in mitochondrial mass.
LC3II protein was quantified by Western blot in control and UVC treated cells with and without bafilomycin and normalized to beta-actin. (a) Steady-state (no bafilomycin) levels of LC3II were significantly decreased by UVC exposure at 24, 48 and 72 h when compared to time point controls (asterisks; two-way ANOVA, effect of treatment P = 0.0325). With bafilomycin, UVC exposed cells accumulated more LC3II compared to bafilomycin treated controls at all time points (hash; two-way ANOVA, effect of treatment P = 0.007). (b) MAPLC3 mRNA expression increased by 1.3 fold with UVC exposure 48 h after exposure (asterisks; two-way ANOVA, treatment × time point P = 0.03; Fisher’s PLSD, effect of treatment P < 0.0424 at 48 h). The black line signifies baseline expression level. (c) Representative immunoblots of LC3II in control and UVC (10 J/m2) exposed cells with and without bafilomycin at 24, 48 and 72 h. (d) No significant change in mitochondrial mass was detected after UVC exposure compared to controls (two-way ANOVA, effect of recovery P < 0.0001, treatment × recovery P = 0.4730). (e) mRNA expression of PGC1a, NRF1 and TFAM, COXIV and COXI. NRF1 expression decreased at 6 h (P = 0.0466). TFAM expression was induced 1.3 fold at 6 h but reduced by -1.20 fold by 48 h (two-way ANOVA, treatment × time point P = 0.01; Fisher’s PLSD, effect of treatment P < 0.05 at 6 and 48 h). Bars ± s.e.m.

