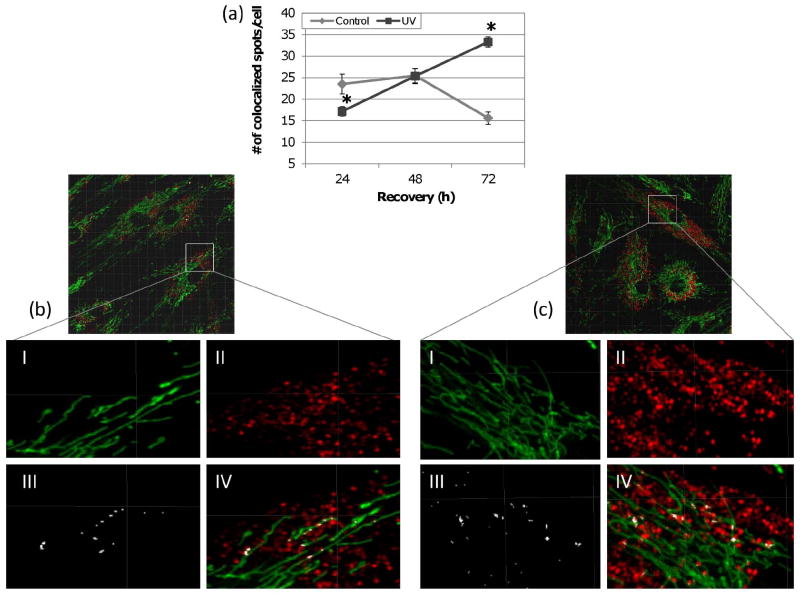
Figure 3. Increased lysosomal degradation of mitochondria after exposure to UVC.
(a) The number of colocalized spots between mitochondria and lysosomes was initially lower at 24 h but significantly exceeded that of control by 72 h (two-way ANOVA, treatment × time point P < 0.0001; Fisher’s PLSD, effect of treatment at 24 h P = 0.0068 and 72 h P < 0.0001). Representative images displaying (I) MTG stained mitochondria, (II) LTR stained lysosomes, (III) colocalized spots and (IV) an overlay of all three as detected by Imaris 3D colocalization analysis in (b) control and (c) UVC treated cells. Bars ± s.e.m.

