
Fig. 6.
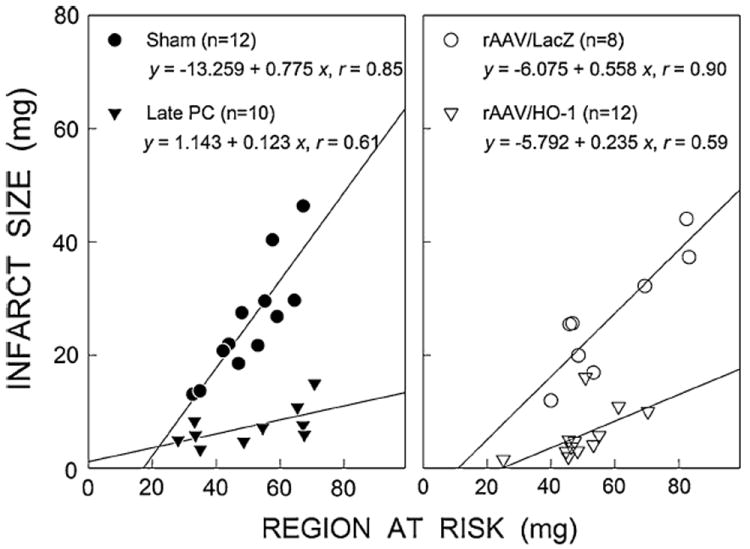
Relationship between size of region at risk and size of MI 1 year after rAAV/HO-1 gene therapy. Graphs show individual values and regression lines obtained by linear regression analysis for the various groups. Left sham and late PC groups. Right rAAV/LacZ and rAAV/HO-1 groups. In all groups, infarct size was positively and linearly related to risk region size. However, the slopes of the regression lines were smaller in the late PC and rAAV/HO-1 groups as compared to the sham and rAAV/LacZ control groups, respectively, demonstrating an attenuated infarct size response to myocardial injury in both of the late PC (24 h) and rAAV/HO-1 gene therapy (1 year)