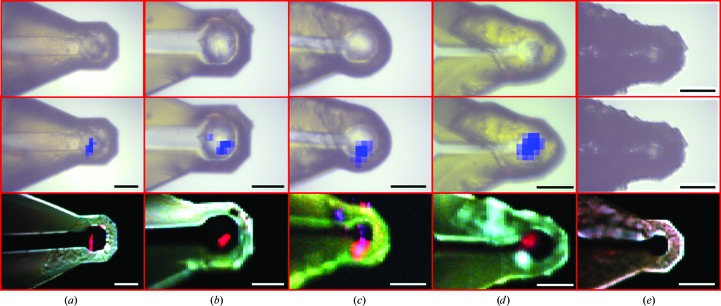
Figure 1.
Comparison of bright-field (top row) X-ray diffraction raster scanning for crystal centering (center row) and SONICC (bottom row) for four representative β2AR-T4L crystals within lipidic mesophase and a control with no protein crystal (rightmost images). In the top row, blue regions correspond to locations of protein-like diffraction overlaid on bright-field images. The bottom row represents composite images: red, transmitted SHG; blue, epi-detected SHG; green, two-photon excited fluorescence. Red regions correlate well with locations of protein crystals of size appropriate for diffraction analysis. Scale bar = 50 µm.

