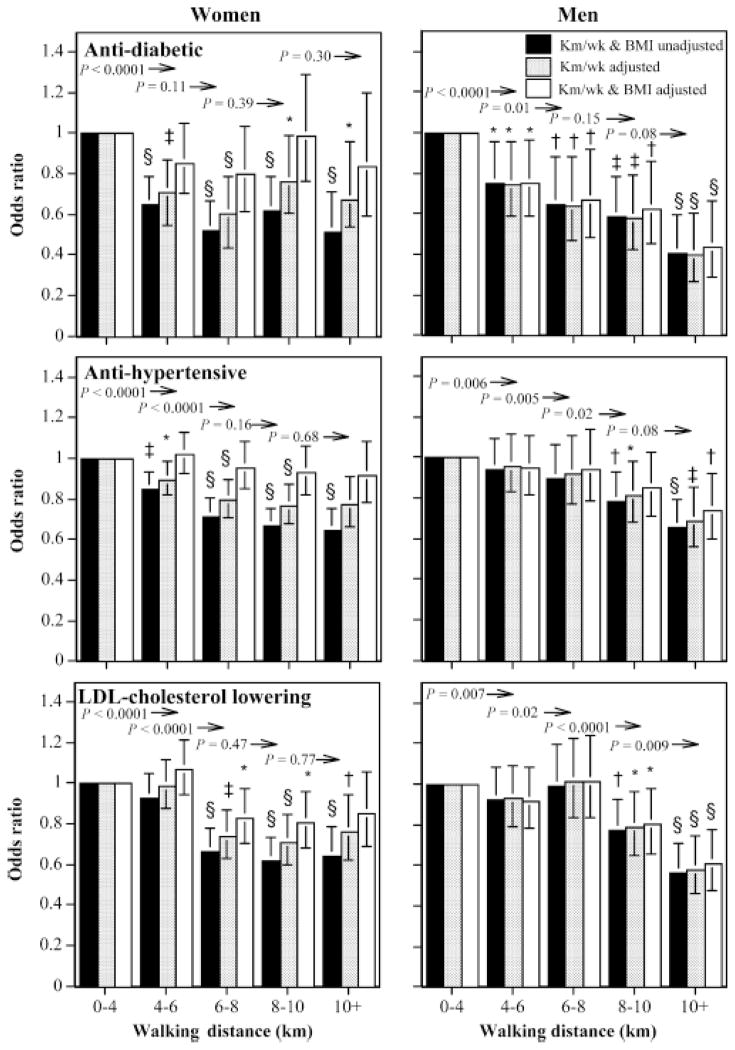
FIGURE 2.
Odds ratios for medication use by longest usual weekly walk relative to < 4 km, adjusted for age, smoking, and intakes of meat, fish, fruits, and kilometers per week and BMI where indicated. Brackets designate 95% confidence intervals. Significance levels for the odds relative to < 4 km are coded: * P < 0.05, † P < 0.01, ‡ P < 0.001, and § P < 0.0001. Significance levels relative to all men of women who walked greater distances are presented above the bars and to the left of the arrows.

