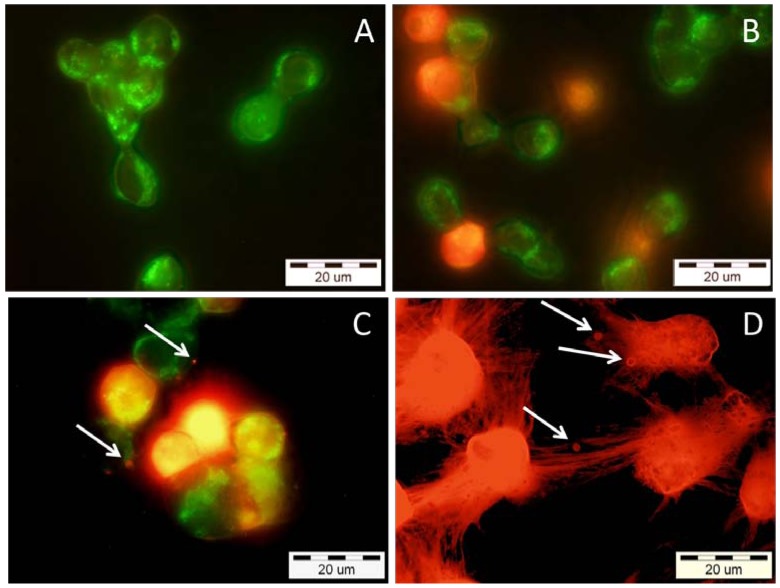
Figure 5.
Epifluorescence micrographs of human K-562 cells after incubation with different concentrations of VBBPLA2. After the exposure, the cells were stained with both Annexin V-FITC and propidium iodide, to visualize the early and late stage of apoptosis and/or necrosis of the cells, respectively. (A) 0.36 μM (expose 24 h)—early apoptotic cells with intact membranes—green; (B) 0.36 μM (expose 28 h)—mixture of early apoptotic cells (green) and cells which have already lost their membrane integrity (orange); (C) 0.72 μM (expose 24 h)—late apoptotic cells (orange to red) with blebbes (white arrows) and green membrane fragments; (D) 7.23 μM (expose 24 h)—totally destroyed necrotic (red) cells with membrane blebbes (white arrows).

